
Tame
-
Posts
13 -
Joined
-
Last visited
Content Type
Profiles
Forums
Events
Blogs
Everything posted by Tame
-
Take for example Fire Strike global points, if you scroll down enough the rankings (in rank 100+ range) you suddenly start encountering 38.6 gl points. Looks like there's still some calc to do.
-
x265 4K global points working bug?
Tame replied to Tame's topic in HWBOT Development: bugs, features and suggestions
Cool, good work. It might clear some general confusion in the future, if a kind of notice banner that informs about ongoing changes/expected anomalies is shown on the HWbot scores page... -
x265 4K global points working bug?
Tame replied to Tame's topic in HWBOT Development: bugs, features and suggestions
Yes... It was not so obvious when I noticed this issue, but a little after many people suddenly got + thousands of global points points from subs that seem to be just average. -
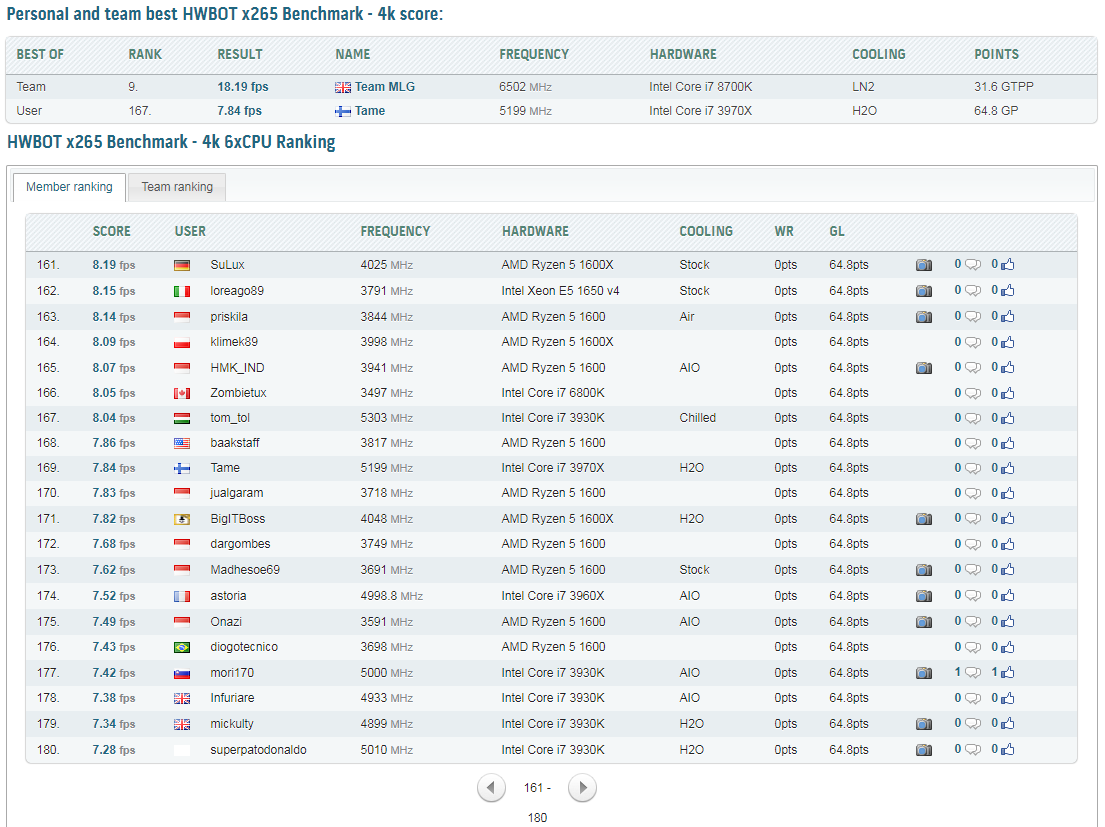
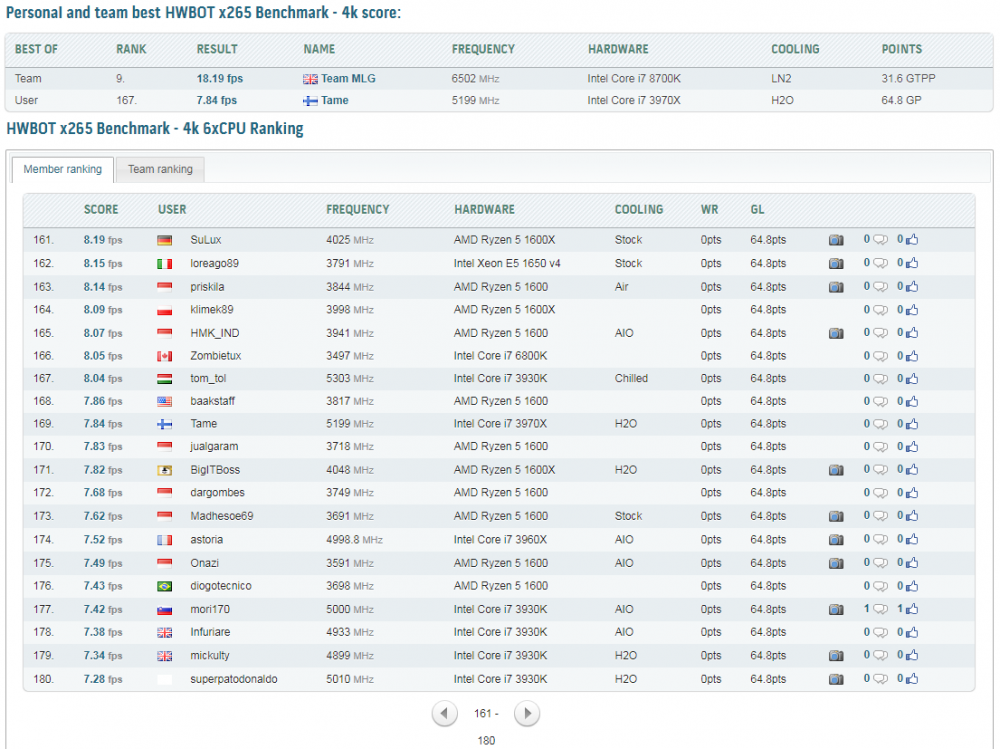
Everybody and their mother is getting 64.8 global pts on x265 4K. Working as intended?
-
Good going
-
Tame - Radeon HD 7850 @ 1370/1500MHz - 12628 marks 3DMark11 - Performance
Tame replied to Jokot's topic in Result Discussions
Thanks! -
Vmod, power limit removed, Hynix memory running 1500 MHz with tight 1125 MHz timings.
-
With Vmod, power limit removed, Hynix memory @ 1500 MHz with 1125 MHz timings
-
Yay, did my first hardware volt mod! These Asus GPUs have a spot made to the side that's asking for a trimmer. NCP5395t you got fooled ;p
-
Yes, but it was not the issue however.
-
Oh this post finally got approved... Anyway, I already figured out what was wrong, so you can ignore this issue.
-
+1 What Buildzoid said... At +380 mV and lower than normal Vdroop setting in Bios the display output circuit signal gets corrupted on Hawaii without modding the 0.95 V rail which I have not done. That's why I now use DVI and 1080p (or lower) @ low refresh rate for less video bandwidth which helps with this. The scores still scale as you would expect with GPU Mhz regardless of the display drop out. Also I didn't use that run for submitted scores, since I got better runs with different conf and actually pretty much continuous video signal. I have EK full cover blocks with upgraded thermal pads on the VRM which prevent them burning out (so far). http://www.overclock.net/t/1638551/testing-results-r9-290-gpu-vrm-vcore-power-measured-with-multimeter-at-different-vid-and-load-line-settings/0_20
-
Hello, I'm new here! And need some insight on this "mystery" I'm trying to solve. I'm trying to do some 3Dmark 11 benching, but some questions arose when I compared my scores to what other high ranked R9 290 users got. In short, especially my GT3 and GT4 scores are noticeably lower than what I would except. I hope someone who's more familiar with the benchmark might be able to give hints what's going on. So, I did a 3Dmark 11 Performance run with i7 3970X @ 5,1 GHz - R9 290 @ 1370/1700: Overall score: P20961 Graphics score: 24916 Physics score: 15318 Combined score: 12801 GT1: 101.80 GT2: 125.18 GT3: 155.97 GT4: 78.74 PT: 48.63 CT: 59.54 (Windows 10) Compared to Mus1mus 1# 1800X @ 4,1 GHz - R9 290 @ 1260/1500 ?!: Overall score: P22514 Graphics score: 25400 Physics score: 18391 Combined score: 14629 GT1: 95.36 GT2: 117.11 GT3: 164.81 GT4: 90.92 PT: 58.39 CT: 68.04 (Windows 10) As you can see, I pull ahead in GT1 and GT2 with the massive GPU clock difference, but he's suddenly got way higher fps in GT3 and GT4. The difference in the physics and combined score is a given, but I can't get my head around the difference in GT3 and GT4. As a test, I severally underclocked my CPU, but it didn't have any effect on the graphics performance. I tried the same (and other) drivers + all the legal tricks I know of (tessellation is ofc disabled etc) to a no avail. I'm left wondering if there's still some secret sauce I can use on my GPU lol. Also, his score is from this summer, so the date is also not that different...