

windwithme
-
Posts
546 -
Joined
-
Days Won
6
Content Type
Profiles
Forums
Events
Blogs
Posts posted by windwithme
-
-
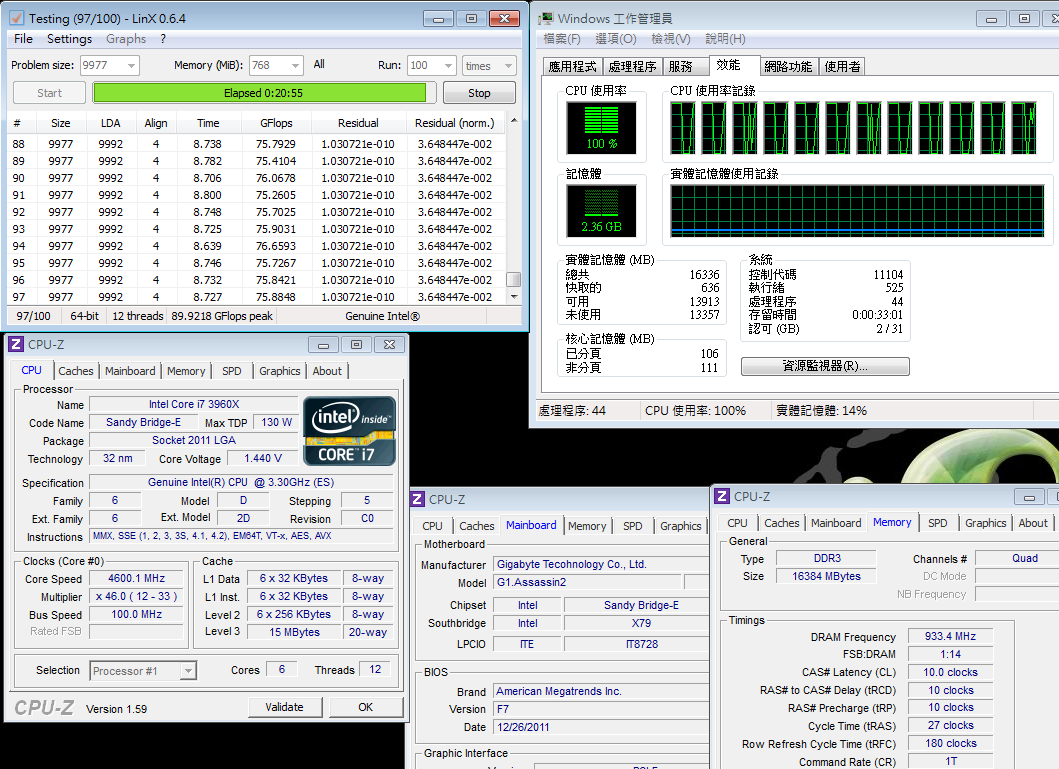
Three Intel CPUs with the Sandy Bridge-E architecture have appeared on the market at different prices
At the end of last year, two CPUs, the i7-3930K 6C12T Core and the 3960X, were released at the same time with the X79 chipset
More recently, the Core i7-3820 was launched as the third CPU, mainly due to differences in the architecture and price of the 4C8T
This appeared to give the entry-level LGA 2011 series a chance to compete with the high-end LGA 1155 series in the marketplace
Based on the cost of these two high-performance platforms, they fall within purchasing range of high-end PC consumers
The X79 chipset can be used with the LGA 2011 platform, and the environment is crowded with many brands of motherboards
In terms of options and prices, this has indirectly given greater flexibility to the X79, a development that is more beneficial to consumers
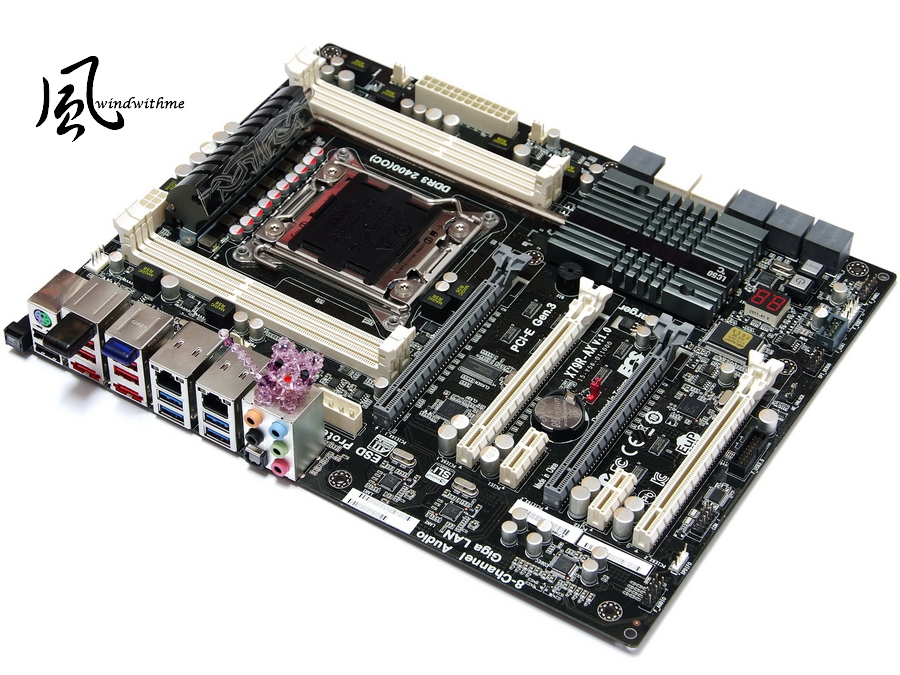
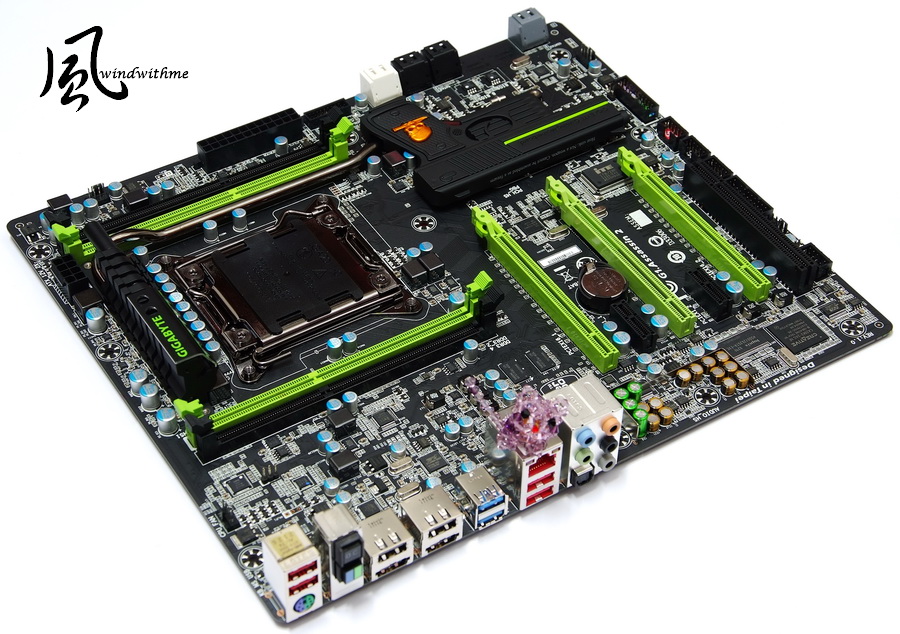
Now, we will share our findings on the X79-based X79R-AX that was released by ECS, a product positioned as part of the Black Series

ECS has launched two models in the X79 space, the X79R-AX and the X79R-AX Deluxe
There should be some netizens who together with me will feel the X79R-AX Deluxe is the more high-end version, yet in fact, the X79R-AX is the higher level version
A glance shows that the X79R-AX uses black as the main color with white and gray as style accents

The dimensions meet the 305mm x 244mm ATX form factor, allowing the choice of a wide range of cases
The X79 is part of the Intel Extreme platform, and the price is a few levels higher than the mid-range to high-end Z68 chipset, but the specifications are almost all higher level
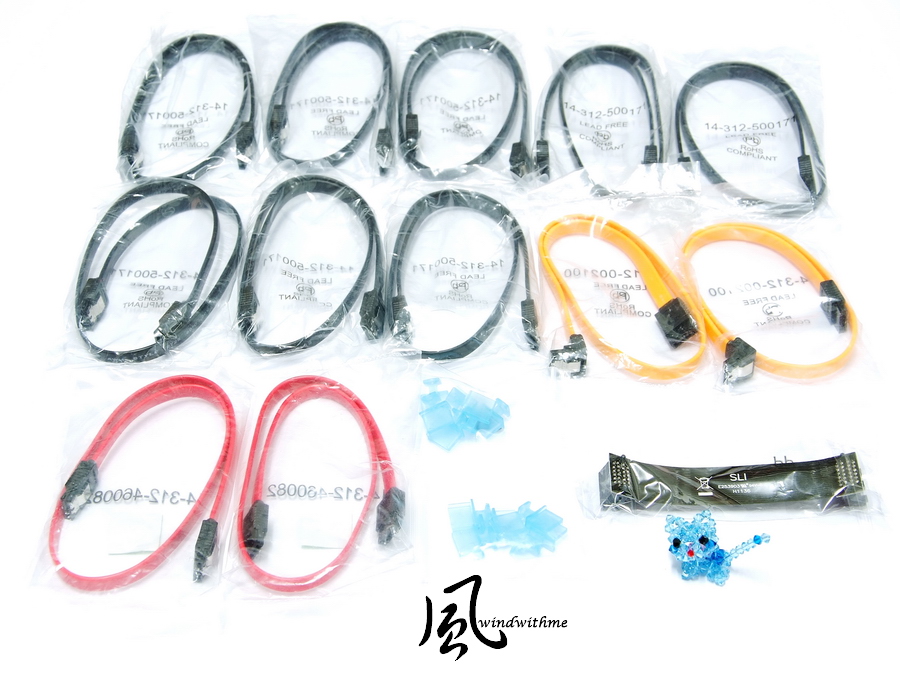
Included Accessories
English user manual, a quick start installation manual, an IO shield, an optical disk with driver software, a USB 3.0 front panel and a mobile connect wireless

An SATA cable that connects to external eSATA devices, a protective plastic cover for the IO interface, SLI bridge
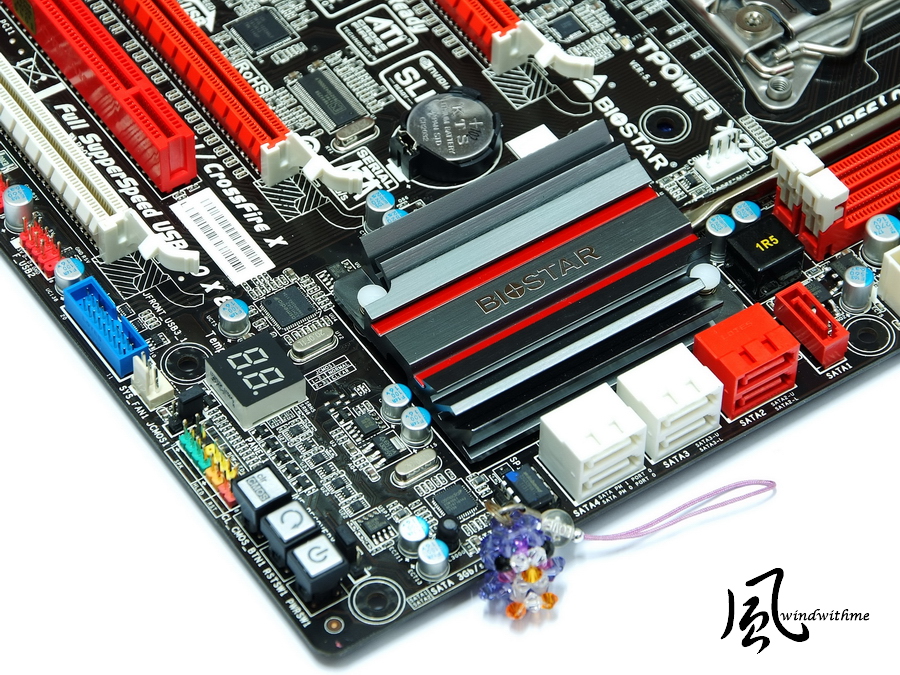
Lower Left of Motherboard
4 X PCI-E X16, supporting up to 4-Way AMD CrossFireX/nVIDIA SLI technology
Bandwidths of X16 + X8 + X16 + X8
2 X PCI-E X1
Dual LAN chip, the Realtek RTL8111E
The audio chip is the Realtek ALC892, with 8 channels supporting HD Audio technology

Bottom Right of Motherboard
The X79R-AX allows the addition of quite a few SATA expansion ports, from right to left as follows
Two gray SATA ports supported by the X79 chipset with SATA3 specifications
Four white SATA ports supported by the X79 chipset with SATA2 specifications
The above can be paired to set up RAID 0, RAID 1, RAID 5 and RAID 10, depending on the highest performance SATA device that has been installed
Four gray SATA ports enabled by the ASM1601 chip with the SATA3 SAS specification, supporting RAID 0, RAID 1, RAID 10
Two gray SATA ports enabled by the ASM1601 chip with SATA3 specifications, supporting AHCI
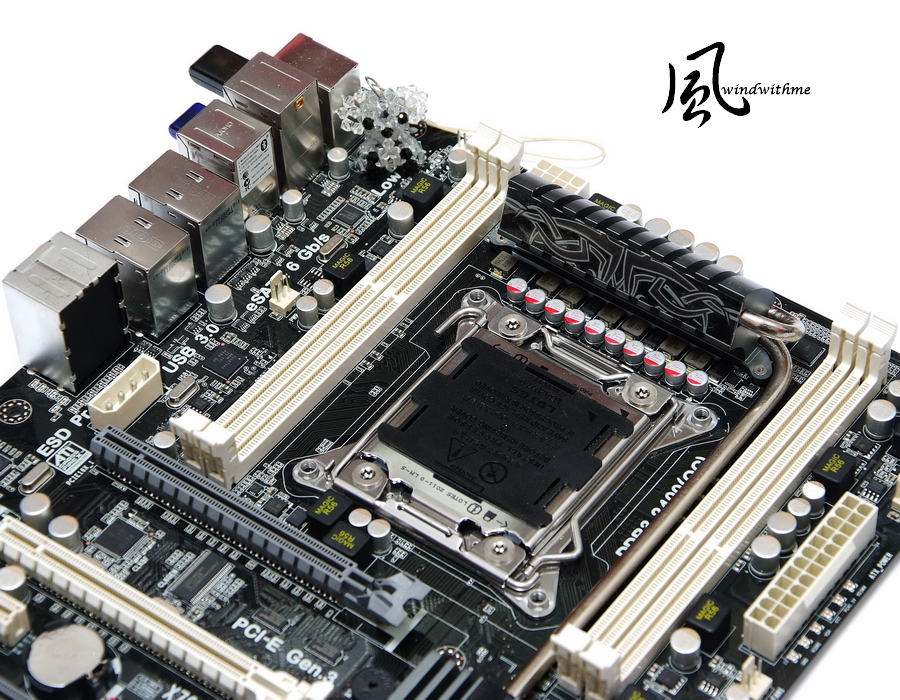
(Simultaneously pressed) the Power/Reset/clr CMOS button and troubleshooting LED lights, to the far left in the front is the black USB 3.0 expansion port

Top Right of Motherboard
24PIN power input, and below, six crossed round terminals allowing users to directly measure the voltage of the hardware with a multimeter
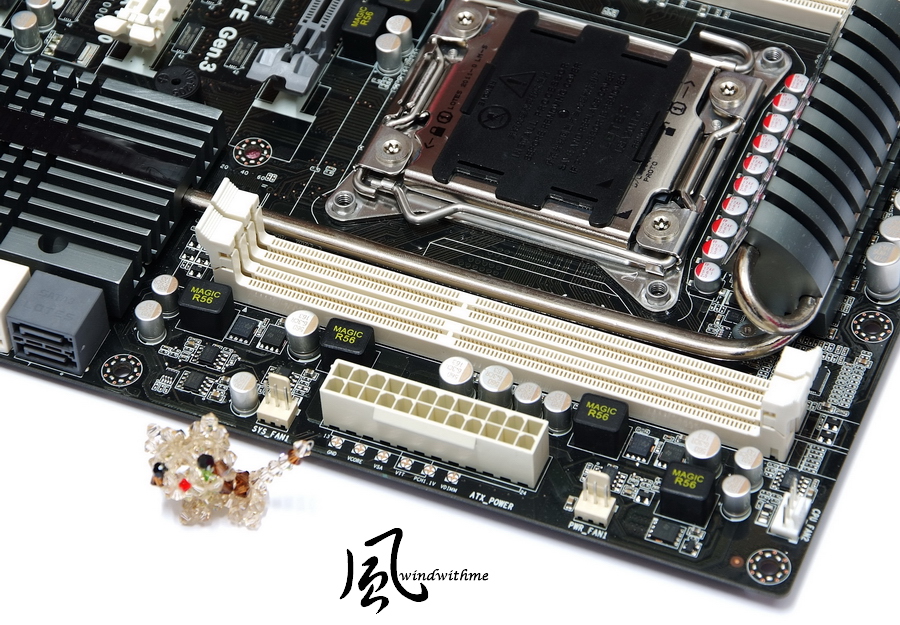
Top of Motherboard
The CPU uses 14 MOS drivers for the power supply combined with a very tactile thermal module that helps the MOSFET dissipate heat
To the right and left are four DDR3 DIMMs supporting 1600/1866/2133/2400/2500 of memory with maximum capacity of 64GB
DDR3 exceeding 2400 meets the OC specification, supporting the latest four-channel technology
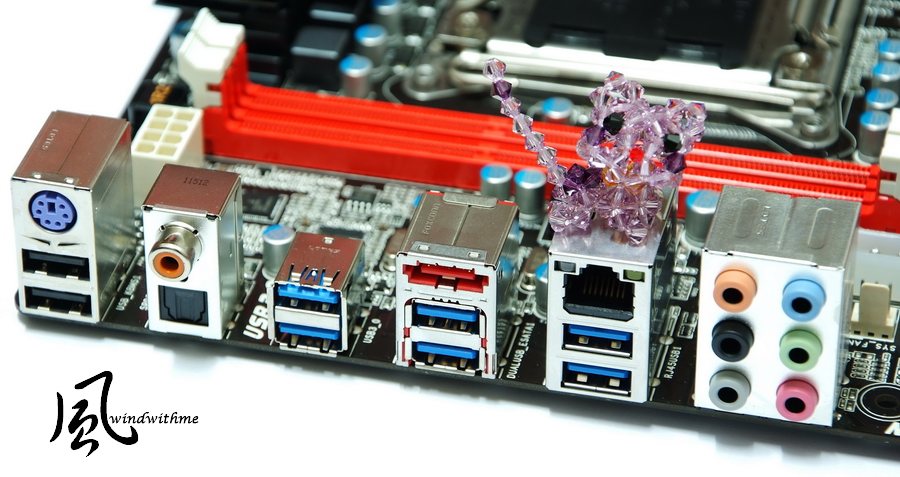
IO
One Clear CMOS button
One PS/2 keyboard/mouse port
Six USB 2.0 ports (Red/Black)
Two eSATA3/USB 2.0 ports (red)
One Wireless LAN dongle
One Bluetooth dongle
Four USB 3.0 ports (blue)
Two RJ-45 Ethernet ports
Six audio jacks

-
Given the same ambient temperature (21 Celsius) and the same 3960X OC 4.75GHz overclocking setting, I measured the MOSFET temperature with a temperature measurement tool.
The highest temperature is 43.1 Celsius during system standby, and 70.1 Celsius when the machine is running at maximum speed.
Among the several X79s I have used, the TPower X79 records the lowest temperature during system standby and at full speed. It is 8~15 Celsius lower than other X79s.
Possibly because of the heat pipe design, the temperature performance of MOSFET is outstanding whether on system standby or at full speed.
If the temperature is too high, I suggest strengthening the MOSFET radiation when overclocking.
Windwithme will measure the temperature of the hardware in this part for every article about X79, for reference.

BIOSTAR TPower X79
ADVANTAGES
1. The overseas price is about US$230 (about NT$6800), which is quite affordable considering the choices for the advanced X79s.
2. The material is 2OZ combined with 8 layers of PCB, and the material specification of other hardware is better than many low-level X79s.
3. The new BIOS could increase the robust DDR3 up to 2400 stably.
4. The radiation system connects the MOSFET and chipset in series so as to lower the temperature more efficiently.
5. For the IO interfaces, it has 6 USB 3.0 interfaces. Including the interface on the front side, it has 7 USB 3.0 interfaces for expansion.
6. Audio chip supports THX technology. The metal cover enables it to have a smooth surface.
DISADVANTAGES
1. The CPU voltage vibrates greatly, which is 1.440V during system standby and 1.416V at full speed.
2. It requires higher CPU voltage for overclocking to 4.8GHz or higher.
3. BIOSTAR has no current distribution channel in Taiwan.
Performance ratio ★★★★★★★★★☆ 88/100
Material ratio ★★★★★★★★☆☆ 83/100
Specification ratio ★★★★★★★★★☆ 90/100
Appearance ratio ★★★★★★★☆☆☆ 73/100
Cost/Performance ratio ★★★★★★★★★☆ 89/100
Stars are used to give a mark for each criterion, with each star representing 10 points. Ten stars represent a full score.
However, the result seems inaccurate, so I calculated the score for each indicator.
Scores were rounded to the nearest whole number in order to obtain more accurate scores.
All these are my opinions after using the advanced X79 on the current market, which are hopefully an easy-to-understand reference.
The photo is taken under the sunlight. The bright light and the golden glow contribute to a higher color contrast.
It took me some effort in taking these photos. Thus, I feel outdoor photography is not as easy as it seems…

Considering its affordable price, the BIOSTAR TPower X79 is worth it in terms of the specifications and the material.
It almost equals the medium-level X79 which is sold at a price of more than US$300. In the whole X79 market, the C/P value is pretty high.
If BIOSTAR could release the advanced X79 of 8DIMM DDR3 and 4Way SLI specification in the future, it could strengthen the X79 product line under its own brand and gain higher competitiveness.
Together with the i7-3820 released lately, the BIOSTAR TPower X79 could provide another new option for the consumers whose budget is only for the high-level 4Cores

Finally, I posted a Microsoft Excel file which indicates the overclocking performance data of several X79s which I shared recently.
I hope it will help you in making comparisons if necessary.
This article is also post in my blog WIND3C, Any comments are welcome.
-
DDR3 Test
ADIA64 Memory Read - 21616 MB/s
Sandra Memory Bandwidth - 52918 MB/s
MaXXMEM Memory-Copy - 18074 MB/s
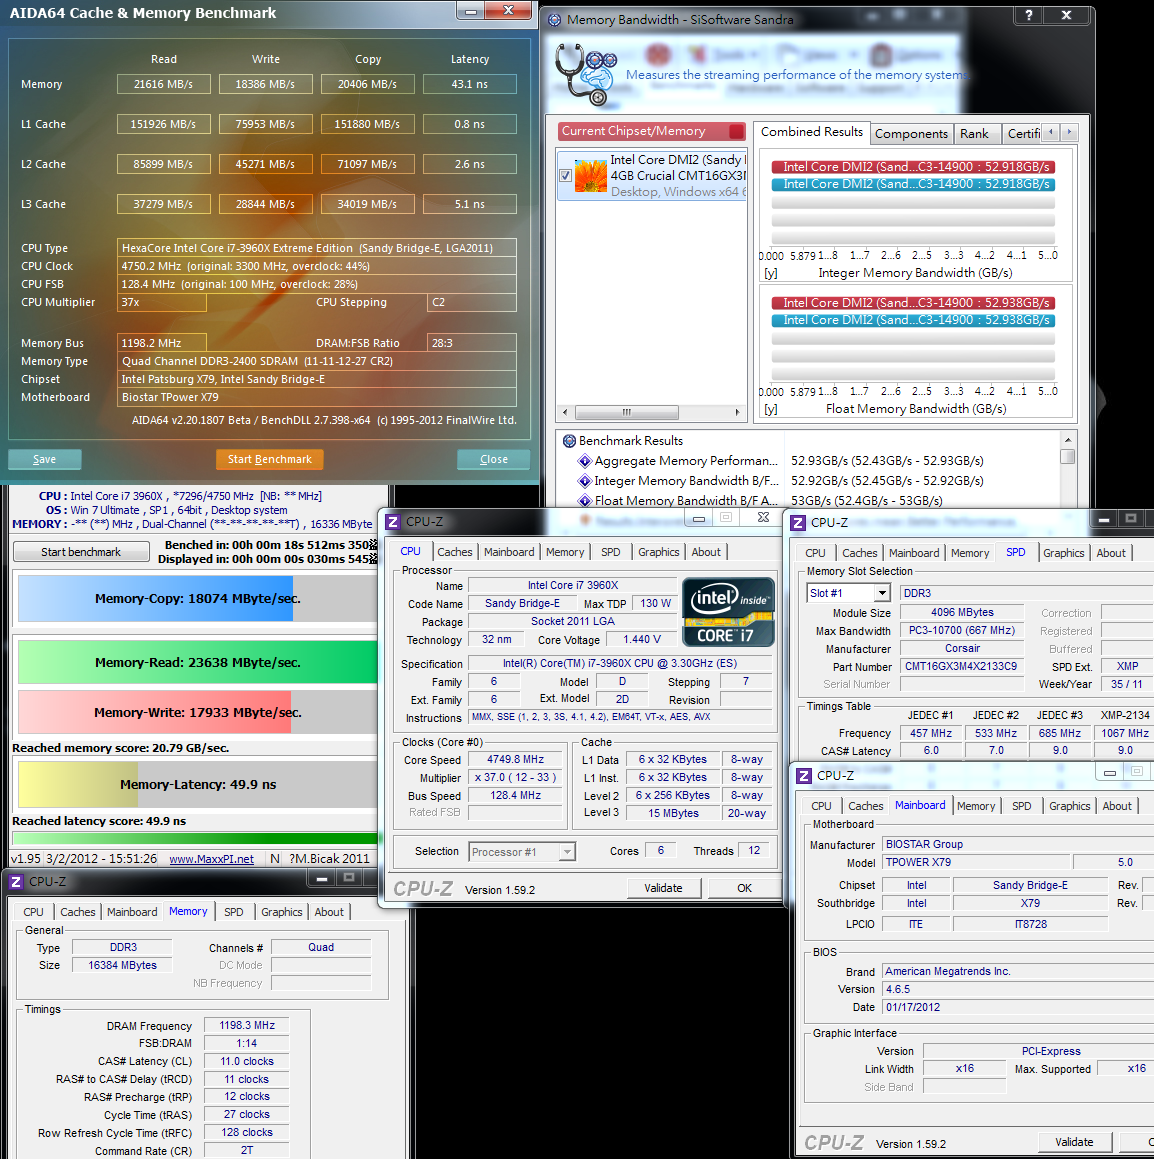
As for the bandwidth, among the various software I have used, SiSoftware Sandra and CrystalMark could reach the four-channel bandwidth.
The obtained bandwidth (MB/s) is nearly twice that of the LGA 1155, which is really a breakthrough for X79 in terms of DDR3 performance.
The TPower X79 could also reach a stable DDR3 2400 level, resulting in a good performance for the DDR3 overclocking range.
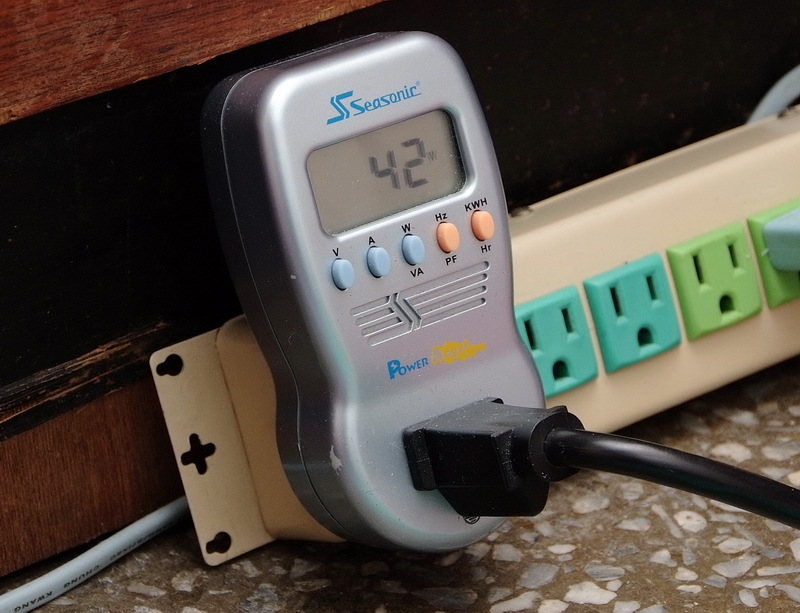
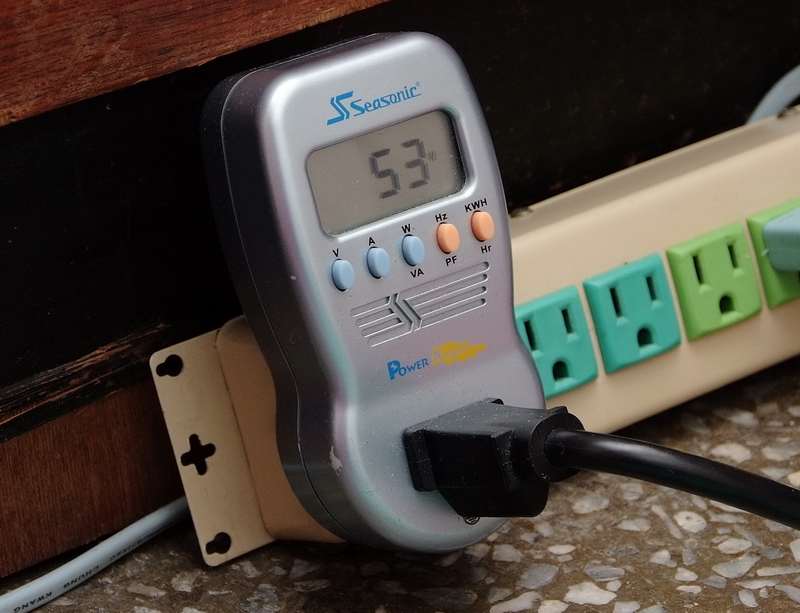
Power consumption test
No software running on the desktop and with the C1E power-saving technology enabled – 96W

No software running on the desktop and with the C1E power-saving technology disabled –165W

Running LinX and the CPU at full speed – 351W

Regarding the power consumption test, it turns out that there is not much difference between X79 and other brands.
It can perform well during system standby and overclocking to 4.75G. If you want to save power, you must enable the C1E function.
The power consumption at full speed is quite high, which is also caused by the 6C12T overclocking to high frequency.
Temperature performance (Ambient temperature is about 21 Celsius)
System standby - 25~37
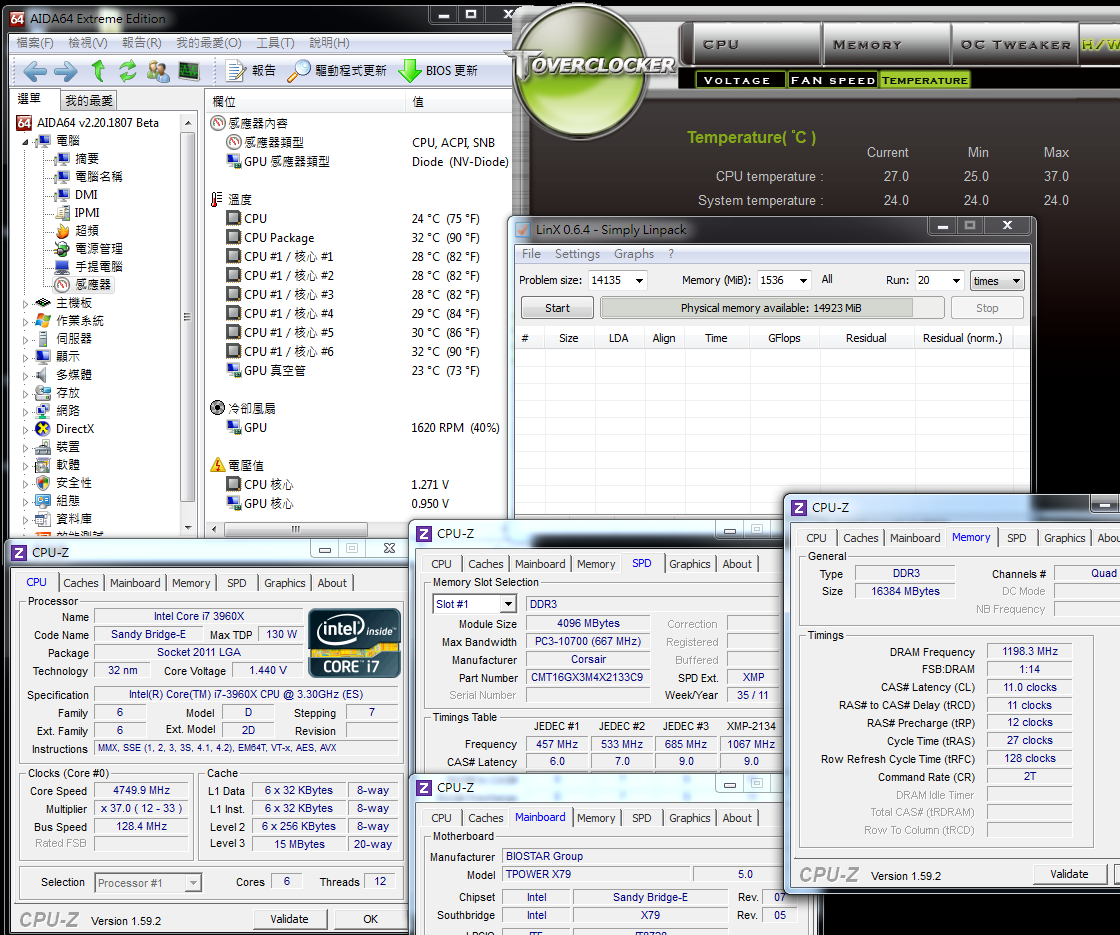
Running LinX and the CPU at full speed –58~64
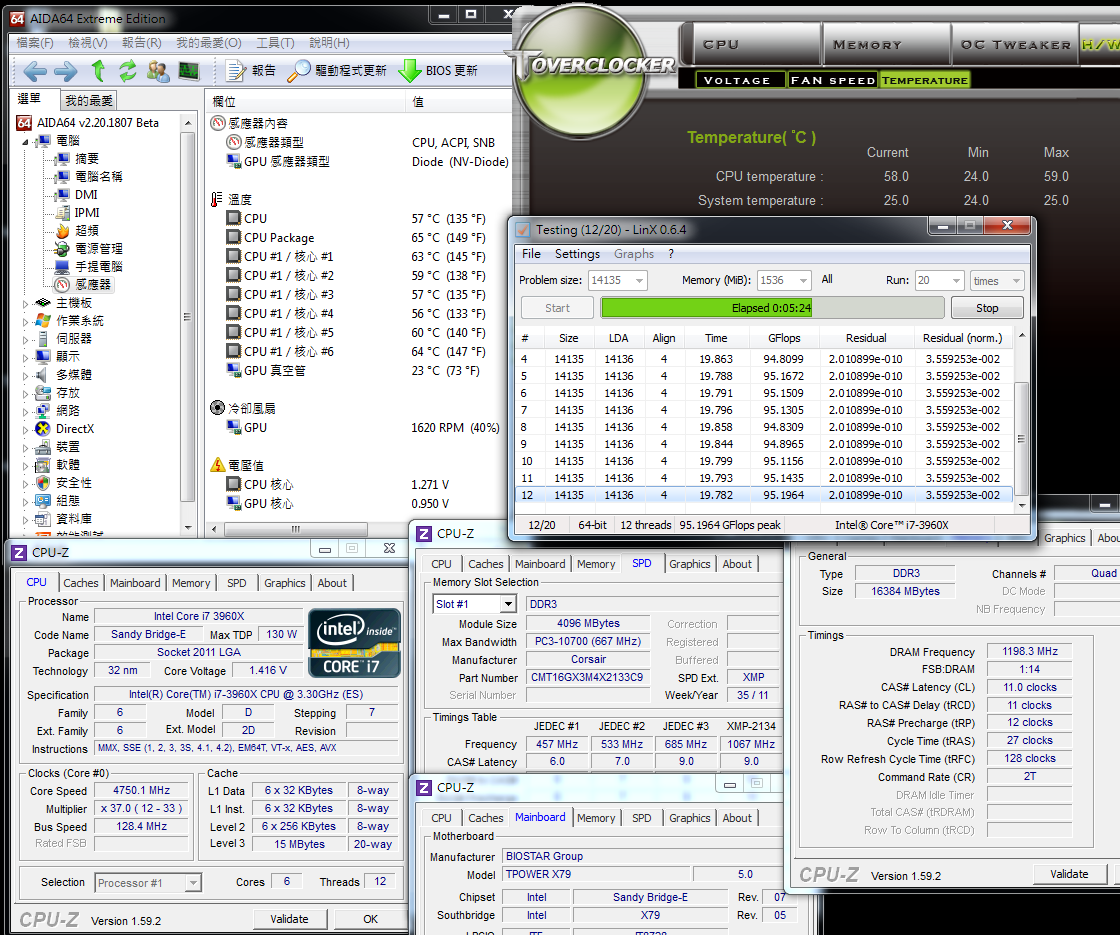
Above is the temperature performance after 3960X overclocking.
The heat sink used is the CORSAIR Hydro Series H80 all-in-one water cooling device.
The temperature maintenance is quite good during system standby, and it is lower than the i7-2600K when at full speed.
The metal cover of the water cooling device is not hot, and the temperature of the LGA 2011 CPU might be lower than the advanced LGA 1155 CPU.
The Sandy Bridge-E CPU may be larger in size, hence the contact area for the heat sink is also larger and the heat conduction is much faster.
3D test
msi N560GTX-Ti Twin Frozr II
3DMark Vantage CPU SCORE => 92320

FINAL FANTASY XIV
1920 X 1080 => 4723

StreetFighter IV Benchmark
1920 X 1080 with the best special effects enabled => 158.13 FPS

According to my usage experience, the 3D performance of the CPU mainly depends on the processing performance of the CPU structure.
The 3D performance of the Sandy Bridge-E structure is quite satisfactory.
However, it will achieve better performance on the 3D software supporting multiple cores.
For example, the CPU SCORE of 3DMark Vantage is higher than 90,000, which is the best among the desktop applications.
-
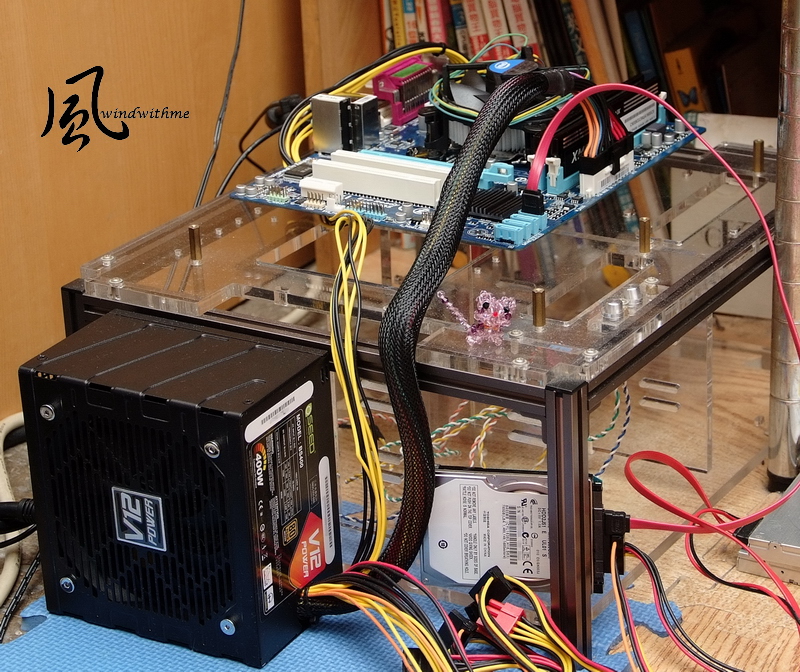
Test Platform
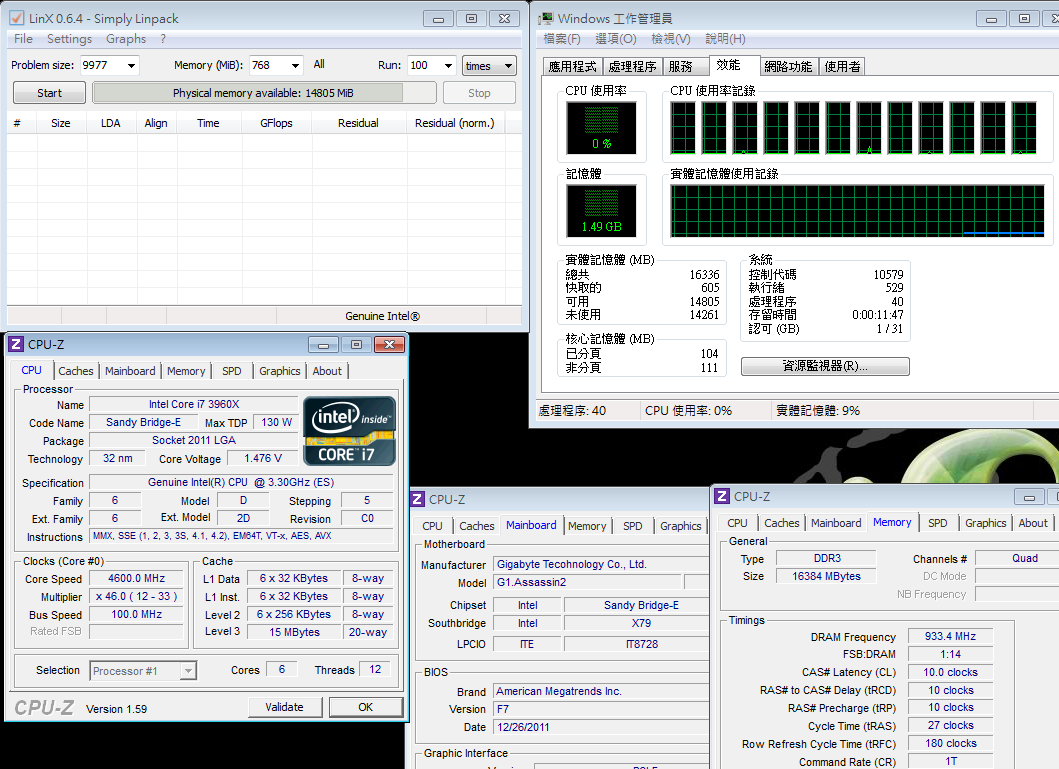
CPU: Intel Core i7-3960X
MB: BIOSTAR TPOWER X79
DRAM: CORSAIR DOMINATOR-GT CMT16GX3M4X2133C9
VGA: msi N560GTX-Ti Twin Frozr II
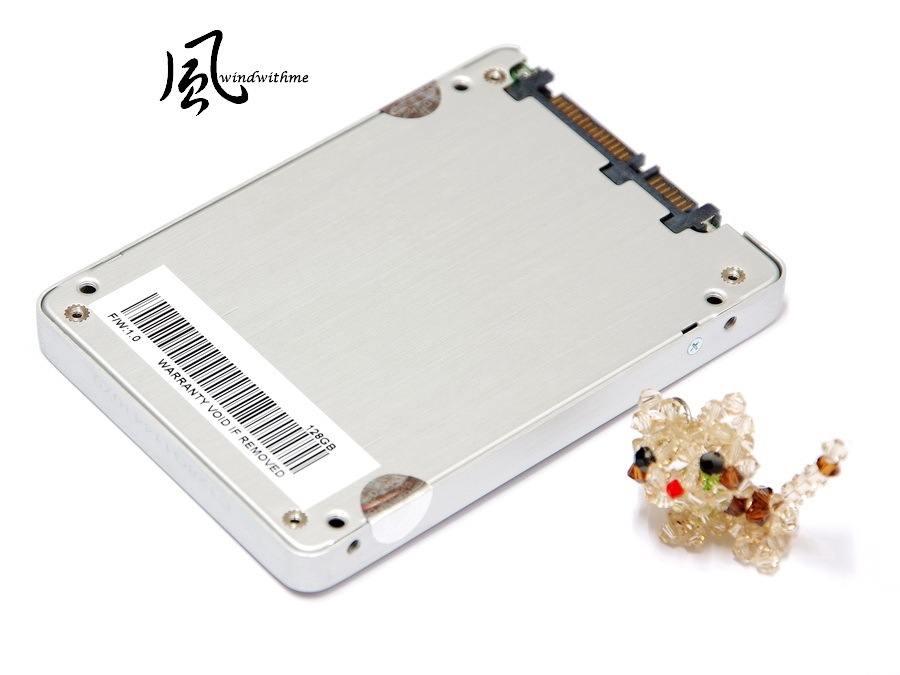
Storage: CORSAIR Performance Pro Series 128GB
POWER: Thermaltake Toughpower Grand 1200W
Cooler: CORSAIR Hydro Series H80
OS: Windows7 Ultimate 64bit

BIOSTAR overclocking software TOVERCLOCKER
The CPU and memory states could be displayed; the frequency could also be slightly adjusted.
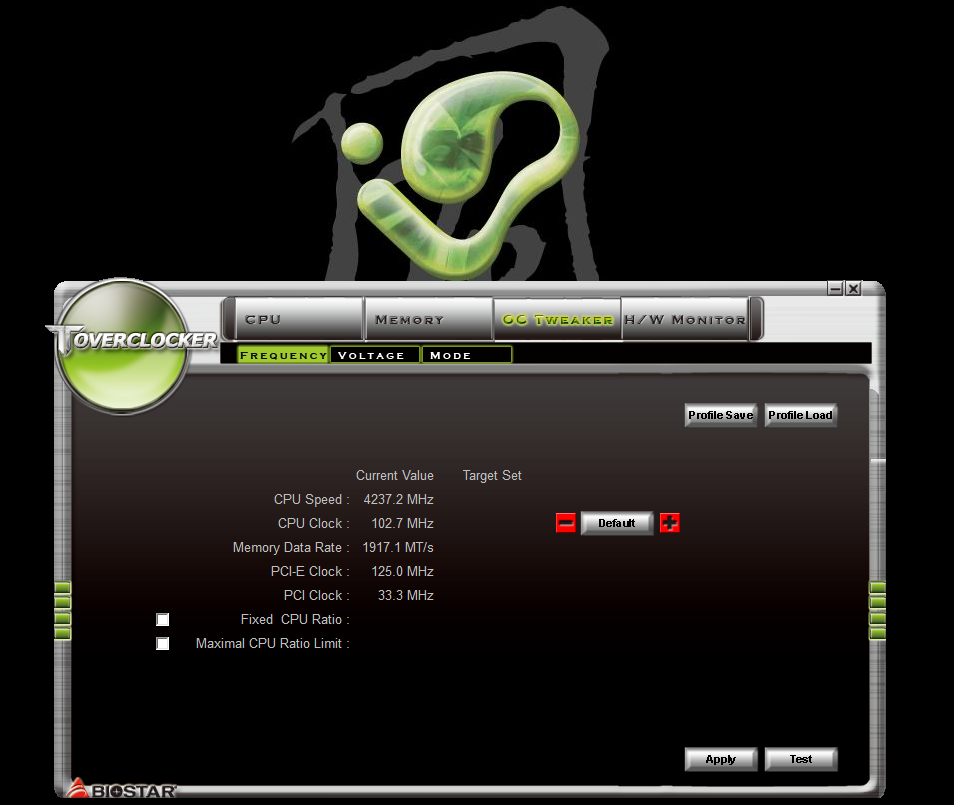
The voltage settings could be adjusted in the OS as well

It provides three automatic overclocking modes, namely, V6, V12 and AUTO.

I used the THX software interface when using the msi Gaming Notebook, which is practical in terms of audio performance.
I selected the options of SMART VOLUME and DIALOG PLUS.
It could optimize the sound field, but the specifications under medium-frequency will be lowered.
I suggest using it under the audiovisual environment.

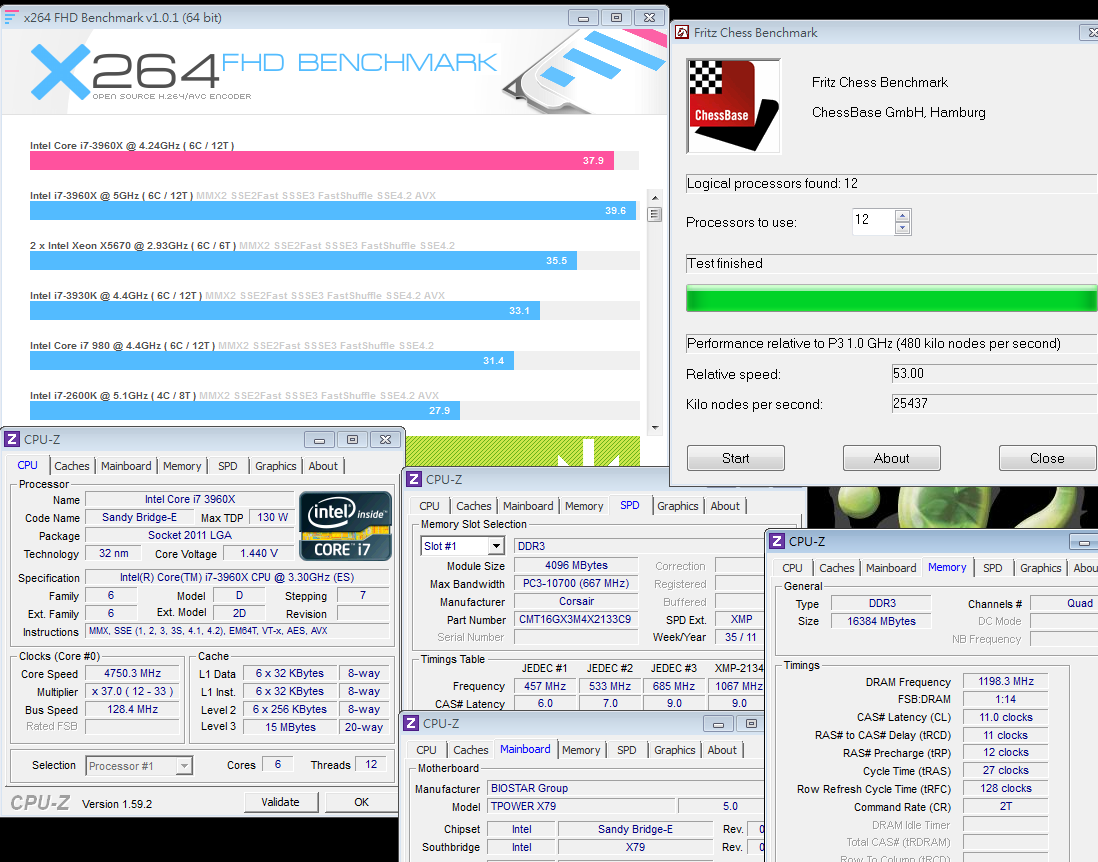
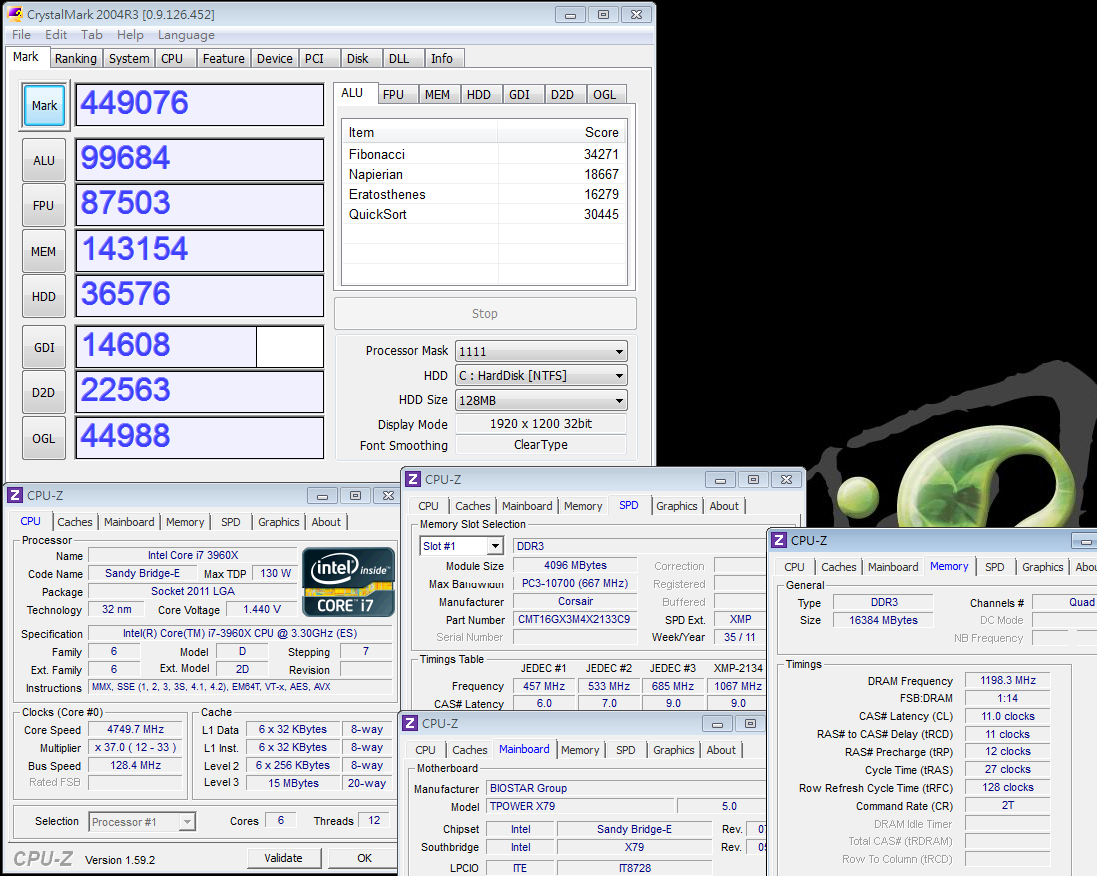
Overclocking test
CPU 128.4 X 37 => 4750MHz 1.416V at full speed
Turn off C1E and Turbo Boost
DDR3 2396.6 CL11 11-12-27 2T 1.625V
Hyper PI 32M X 12 => 11m 52.578s
CPUMARK 99 => 728
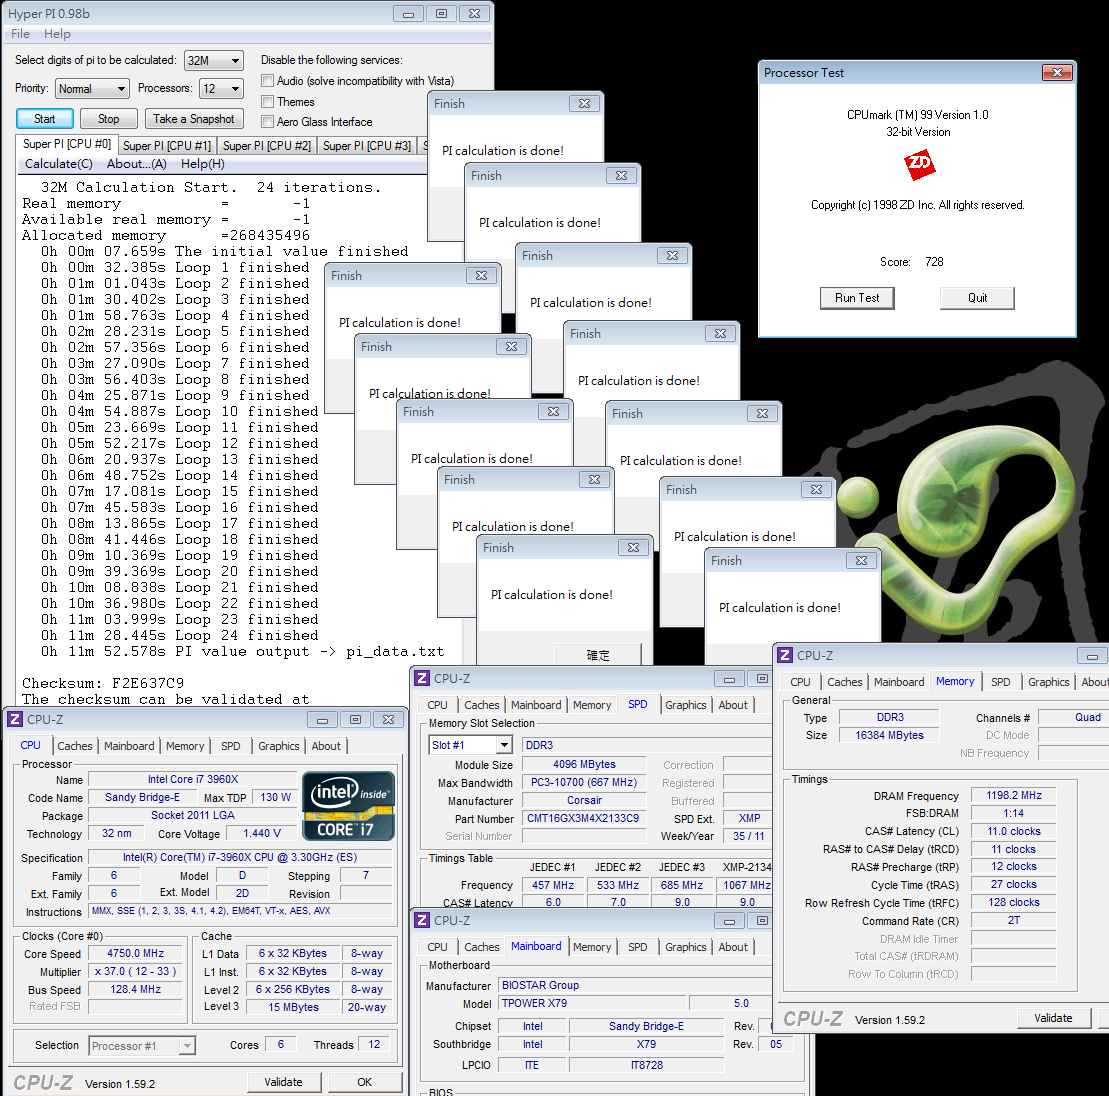
x264 FHD Benchmark => 37.9
Fritz Chess Benchmark => 53.00/25437
CrystalMark 2004R3 => 449076
CINEBENCH R11.5
CPU => 13.85 pts
CPU(Single Core) => 1.92 pts
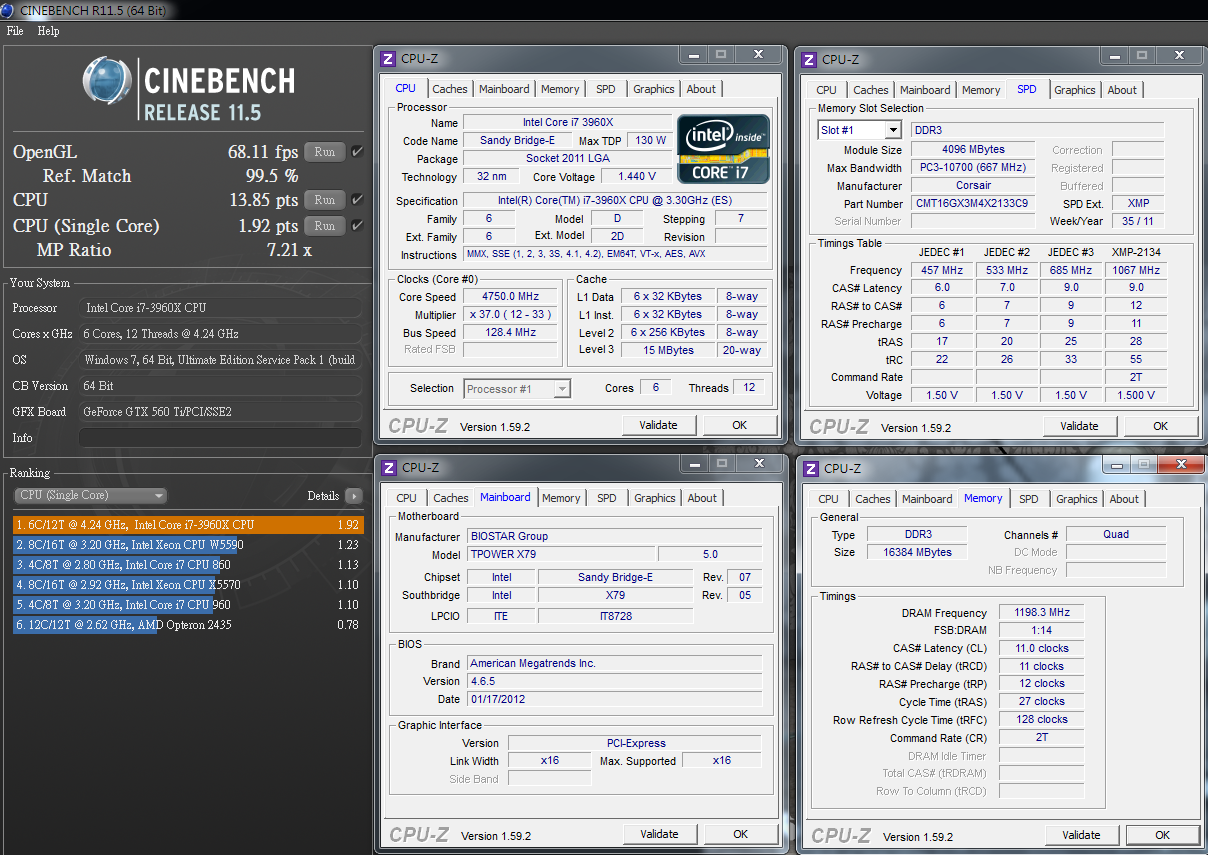
PCMark Vantage => 25545
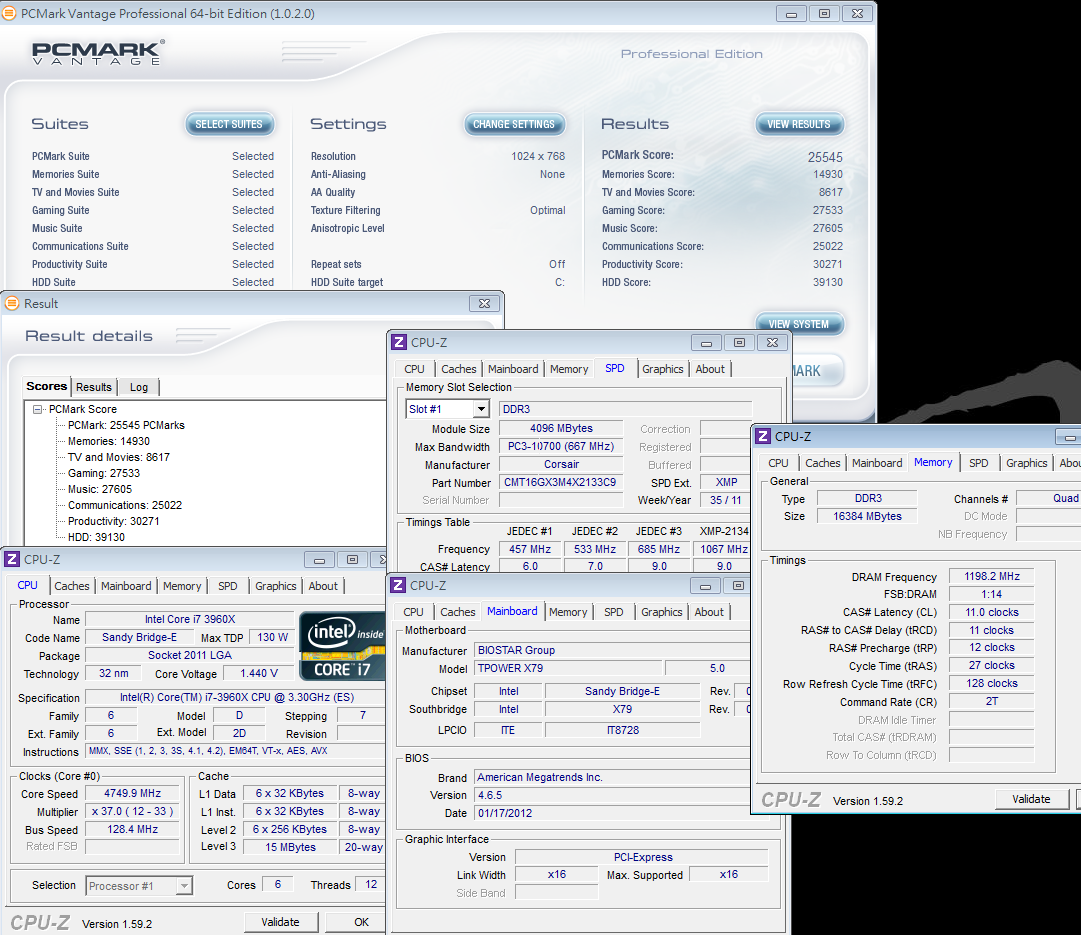
When the 3960X is overclocked to 4.75G, the voltage is 1.416V at full speed. I will share its performance under the stable working conditions.
As an Extreme platform, the CPU could achieve the highest performance for desktop use whether under single-thread execution or multi-thread execution.
If you want to do overclocking frequently, I suggest you do it under a good radiation environment, and keep the voltage lower than 1.45v.
-
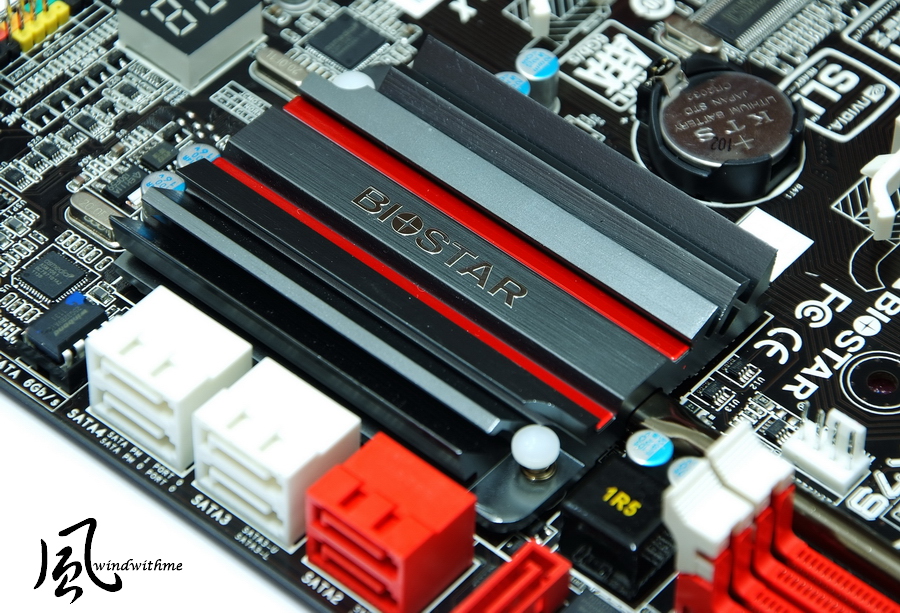
This part uses three ASM 1042s, and provides 6 USB 3.0 interfaces for the user.

From the large MOSFET radiation module, we can see a special design, leaving a larger space for radiation.

The radiation module of X79 chipset is mainly in silver black. With the hairline crack on the appearance, its texture is quite good..
It is linked with the MOSFET radiation module by a heat pipe, so that the hardware temperature could be balanced effectively.
BIOS adopts a UEFI interface and comes in plain color. BIOSTAR prioritized the practical application of the unit.
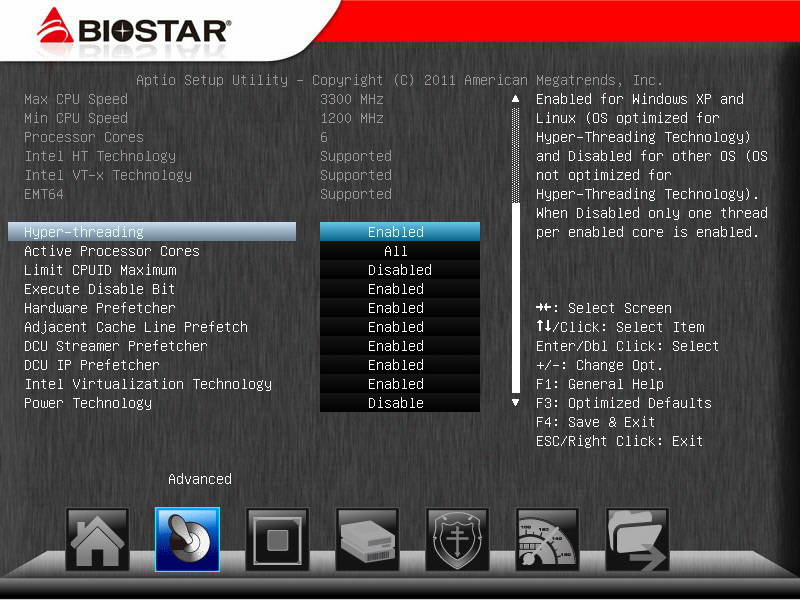
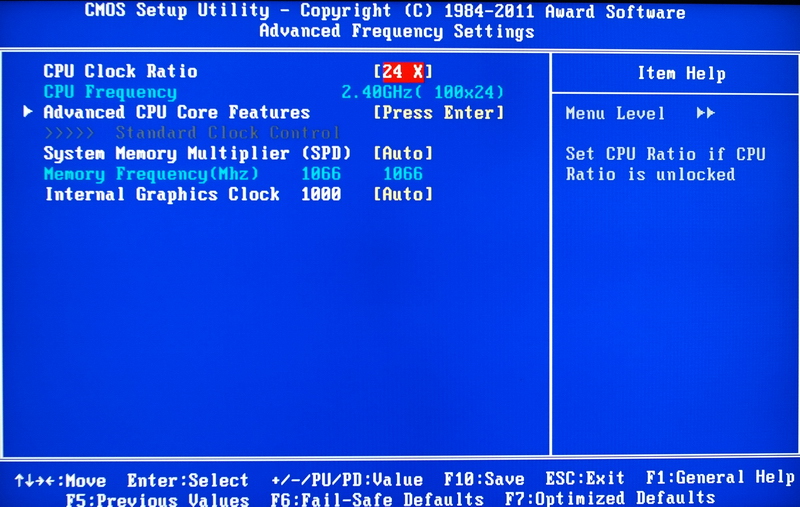
Page for CPU information and related technologies
O.N.E calibration page
The default value of the 3960X is adjusted from 100MHz to 125MHz, and the Hlst Clock is also slightly adjusted so as to achieve the frequency of 128.3MHz
The frequency multiplication of the CPU Ratio is adjusted to 37 and then the CPU C1E is turned off.
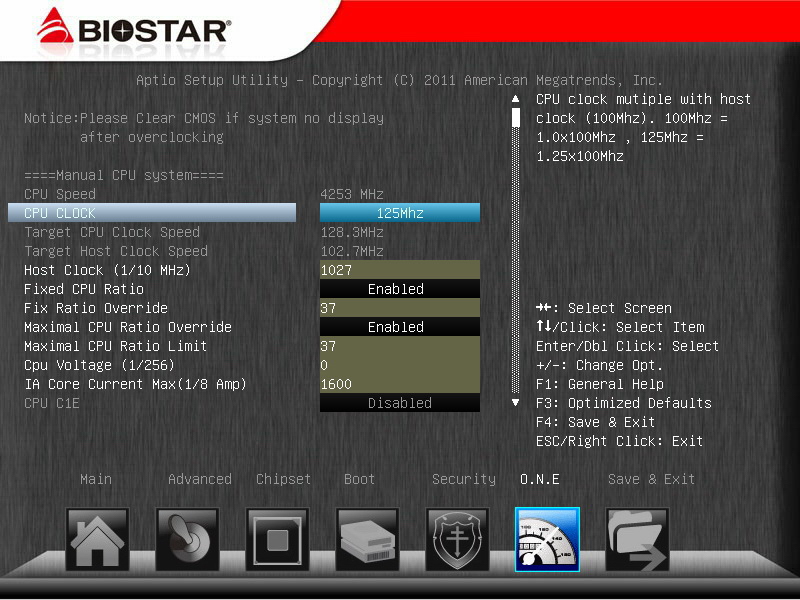
Four CPU VCore Modes, namely, SPEC Volgate/Auto/Offset Mode/Fixed Mode
CPU VCore Offset -0.200~+0.520V
CPU VCore Fixed 1.000~1.520V
There are four types of CPU VCore Modes, SPEC Volgate/Auto/Offset Mode/Fixed Mode
CPU VCore Offset -0.200~+0.520V
CPU VCore Fixed 1.000~1.520V

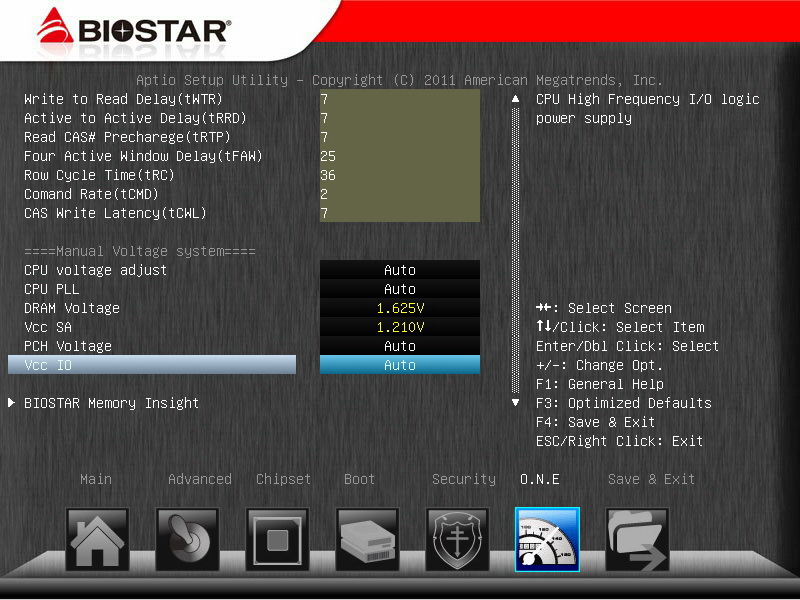
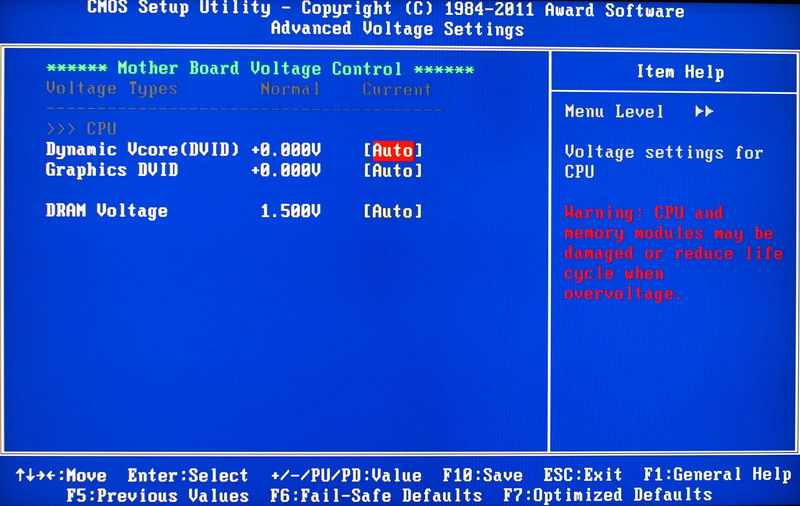
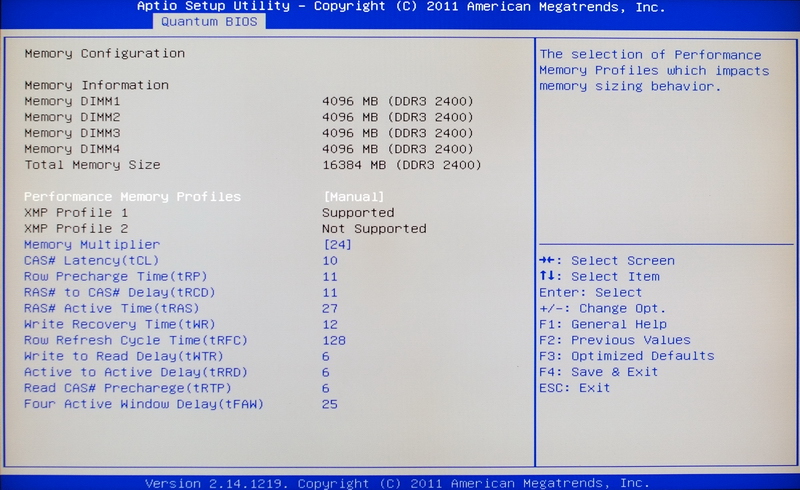
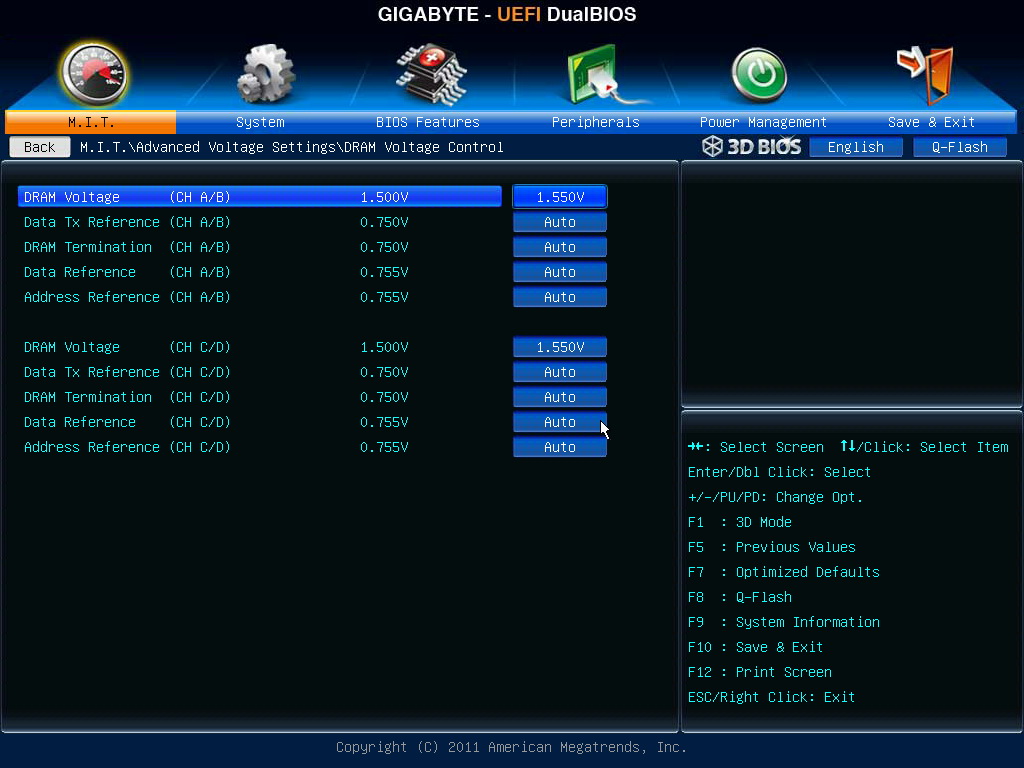
DDR3 parameter and frequency settings
Memory Multiplier is set at 18.67. By increasing the external frequency of the CPU, it will be close to DDR3 2400.

The upper side is the detailed DDR3 parameter setting options
The lower side is the voltage specification of the other parts. Except for CPU voltage, there are two other voltage options as follows.
DRAM Voltage 1.150~2.075V
Vcc SA 0.880V~1.820V

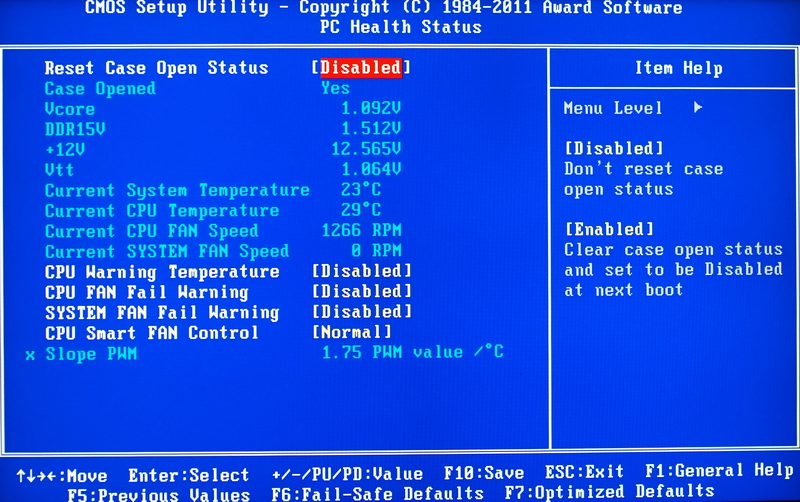
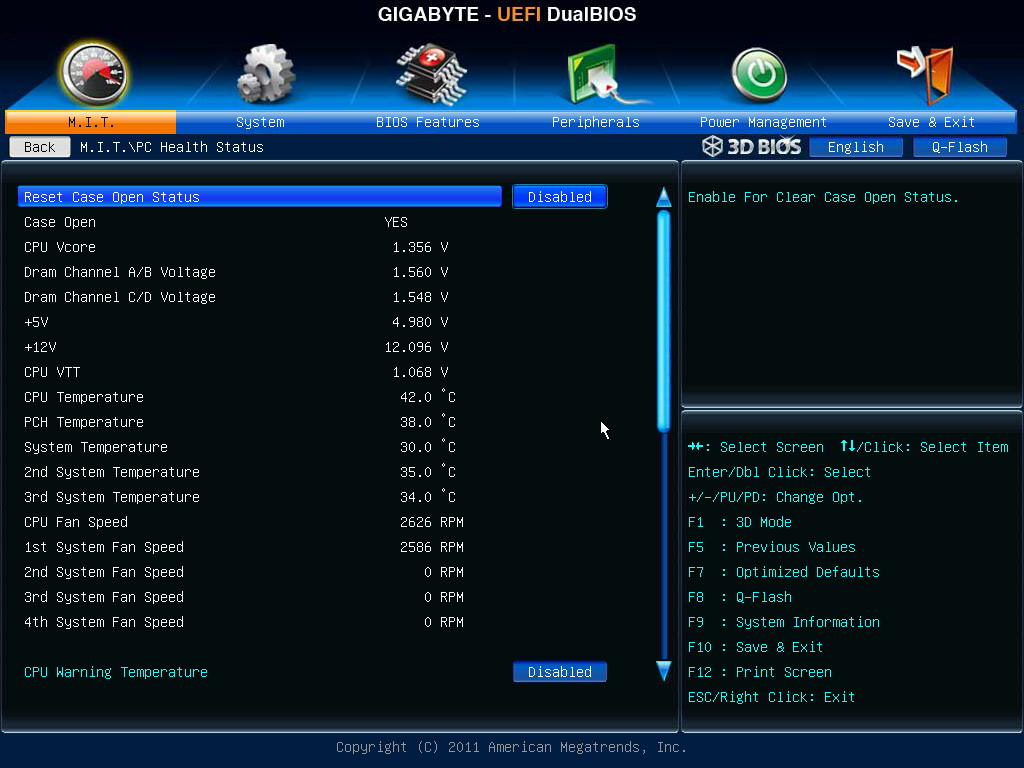
PC Health Status
The CPU temperature detected here is higher than the temperature felt from the air from the heat sink or that detected by the software installed in the OS.
There are two methods of overclocking for the LGA 2011 structure.
One is directly adjusting the CPU frequency multiplication and the DDR3 frequency, so that the CPU could reach 4.5~4.8GHz or higher.
Moreover, the DDR3 could also be adjusted as 1600/1866 or 2133/2400 according to its power.
The other method is more complicated. Overclocking is achieved by increasing the CPU frequency multiplication or testing the maximum limit of the DDR3 2400, which is helpful to those who pursue DDR3 limits.
For either method, if you are in the environment of DDR3 2133 or higher or you are using the increased external frequency of the CPU,
I suggest setting the Vcc SA voltage as 1.000~1.200V according to the CPU’s power so as to increase the stability.
-
It’s been more than three months since Intel Sandy Bridge-E was released last November.
There are three types of CPUs, two 6C12T types, and the affordable 4C8T i7-3820 released lately.
There are a lot of MB brands of Intel X79 chipset on the market.
Among the various MB brands in the market, the X79 is considered as the newest state-of-the-art product.

This time Windwithme is going to share the details about the overclocking experience of the X79 for the fourth time.
The X79 is manufactured by BIOSTAR and it boasts of high-performance overclocking features and an affordable price.
The currently released X79 belongs to the TPower series, and is classified as the technologically advanced product line of BIOSTAR.

First, let’s have a look at the BIOSTAR TPower X79.
It has 8 layers of PCB boards, and its whole body adopts black as the base color and red as the auxiliary color. White is used for the expanded slots.
Based on the common ATX spec, it is 30.5cm X 24.4cm (W X L).
In spite of its fair price, its material and specification can almost be considered as medium-level.

Accessories Included:
Product manual, IO board, SATA wires and CrossFire / SLI network bridge

The lower left section of the motherboard
3 X PCI-E 2.0 X16 supports 3-Way AMD CrossFireX/nVIDIA SLI technology at most, and the bandwidth is X16 + X16 + X8
2 X PCI-E X1
2 X PCI
Network chip: Realtek RTL8111E
Audio chip Realtek ALC892 supports 8-channel Blu-ray Audio and THX TruStudio Pro technology at most

The lower right section of the motherboard
3 X red SATA2 and 2 X white SATA3 connectors are provided by the X79 chipset; it supports RAID 0,RAID 1, RAID 5 and RAID 10.
The maximum performance depends on the installed SATA equipment.
2 X white SATA connectors are provided by the ASM1601 chipset, with the SATA3 specification and AHCI support.
The blue section on the left includes the front USB 3.0 slot, power, reset buttons, and a simple built-in Debug LED
The upper right section of the motherboard
It has a 24-PIN power input and a second 8-PIN power input. The DDR3 adopts a two-phase power supply design.

The CPU power supply design has 9 phases in total, namely, 6 VCORE phases, 1 VSA phase and 2 VCCIO phases.
4 X DIMM DDR3 slots support 800/1066/1333/1600/1866/2000(OC), and the highest DDR3 capacity supported is 32GB.
It supports 4 channels and Extreme Memory Profile technology, and the upper left is the first 8-PIN power input.

IO
1 X PS2 Keyboard
2 X USB 2.0(Black)
1 X S/PDIF Out
6 X USB 3.0(Blue)
1 X eSATA2(Red)
1 X RJ-45 Network hole
6 X Audio holes
The upper side of the audio chip has a metal cover, where the BIOSTAR Logo is printed and which displays a red light when powered on.

-
Enable C1E power saving technology. BIOS set CPU voltage to -0.240V which is only 0.888V for standby and full speed.
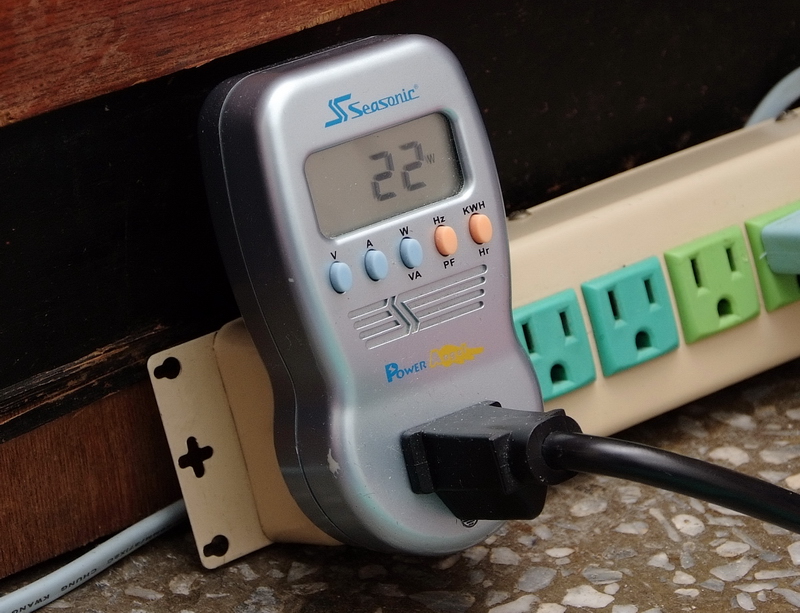
Enter to OS Desktop - 22W
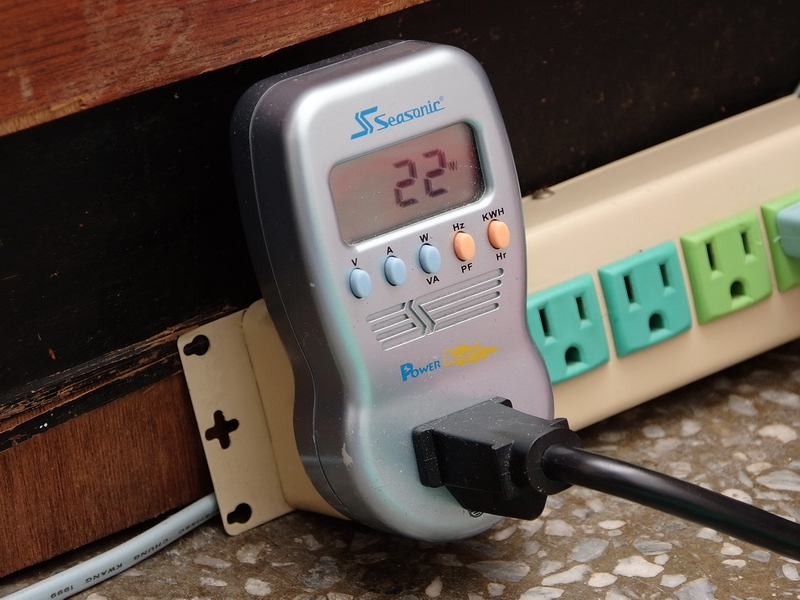
Running LinX to full speed CPU - 34W

After lower CPU voltage to 0.888V, the standby voltage is close to C1E default 0.86V.
The key is CPU full speed drops to 34W which is 20% lower. CPU temperature also goes lower. As this setup, you have to make sure your CPU can run stable.
Video Playback
Original Blue-Ray Video, Inception. The copyright belongs to publish company.
I use software PowerDVD 10.
During playing video, CPU utilization ratio is 22~35%

CPU utilization ratio is around 22~35%. For 1920 X 1080 HD video, it can play smoothly.
G530 built-in Intel HD Graphics CPU utilization ratio is not as low as HD 2000 or HD 3000, however, Intel entry platform is capable for HD video playback now.
In the market, there is G540, but I prefer to use G620 to compare with.
The performance and spec difference are bigger. It can be your next step option.
It’s just one year. Intel entry PC cost drops almost 30%.
It’s all due to Pentium and Celeron Sandy Bridge CPU appears.
Also H61 MB competition, DDR3 and DVD-ROM price dropping, it makes users can have more powerful system in lower budget.
If you change the HDD to 500G, plus DVD-ROM and Case, the cost is around 353USD.
In this guide, I would like to have both performance and quality, so some components are more high end/
If you have budget concern, you can use DDR3 1333 4GB and none APFC 350W PSU.
The cost will drop to 300USD. It will be the more entry Intel PC.
It takes me around one week to finish this test. There are many brands in the market.
You can adjust the spec by your requirement, budget and favorite brands.
One day, if the 3D performance is not enough, you can just add an external VGA card to enhance it.
2012 is 12th anniversary of windwithme.
I started this as passion and keep it till now. I will be always a neutral editor.
I hope my review can be the complete guide to all users.
It’s holiday season for building new PC. I hope this review is valuable for your reference.
If I get time, I will share AMD entry PC. Wish all best to you.

This article is also in my blog WIND3C, Any comments are welcome.
-
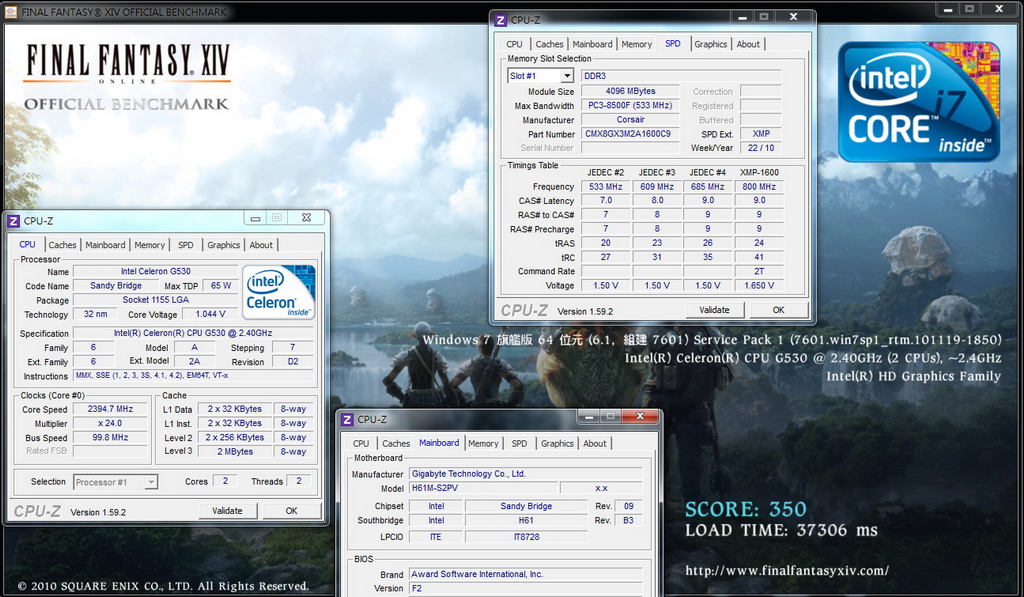
FINAL FANTASY XIV
1280 X 720 => 350
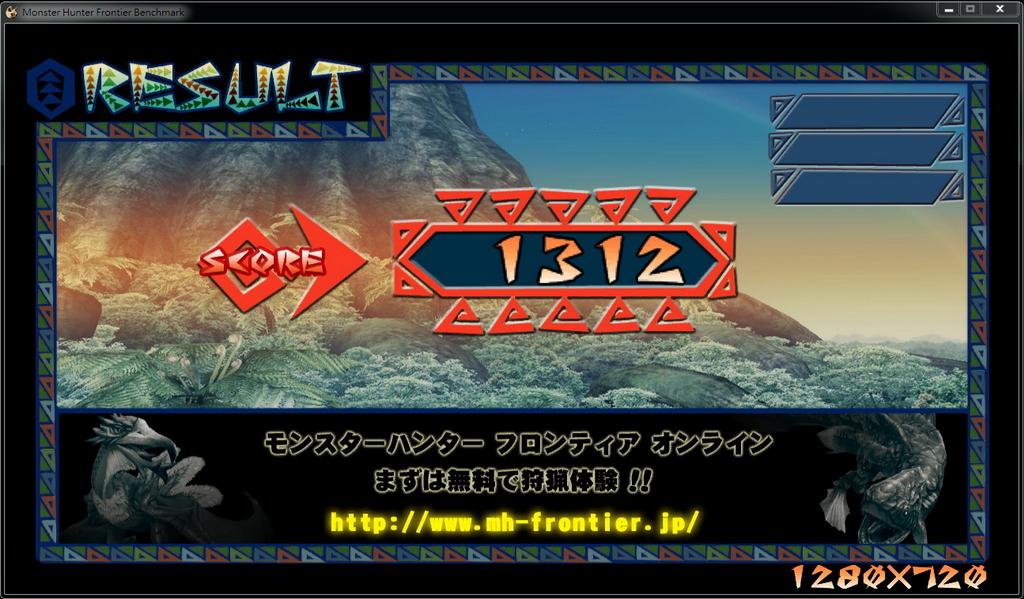
Monster Hunter Frontier => 1312
Improved 3D performance and HD video playback are key features for LGA 1155 platform. You can see the obvious progress.
G530 and G620 both use Intel HD Graphics, but G530 3D performance is 22~30% lower. This is the key difference of these two CPUs.
Intel HD Graphics OC to 1200MHz
StreetFighter IV Benchmark
1280 X 720 => 28.63 FPS
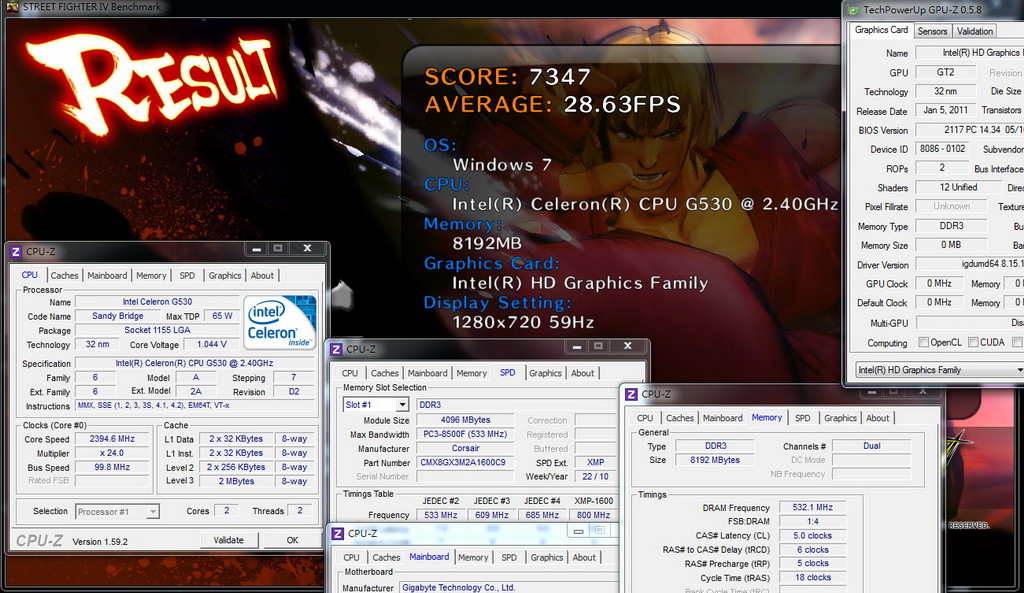
FINAL FANTASY XIV
1280 X 720 => 408

Monster Hunter Frontier => 1538

Pulling high GPU clock 20%, the 3D performance improves 15~17%. It’s better than nothing.
If you need higher 3D performance, you better to choose G620 or G840.
If you are playing 3D games, you better to have individual graphics card.
Temperature (Room Temp. is around 19 degree C)
Enter to OS Desktop - 26
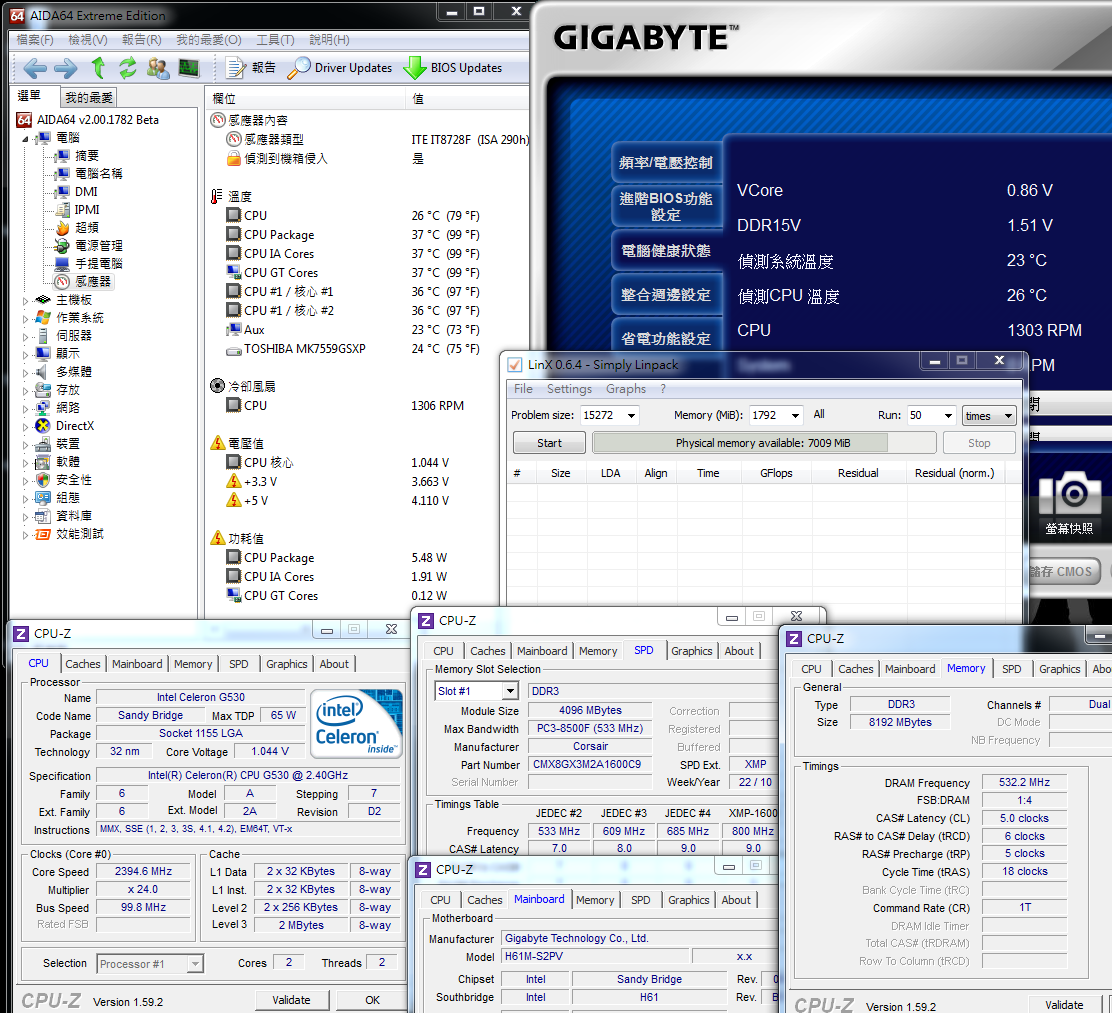
Running LinX to full speed CPU - 33
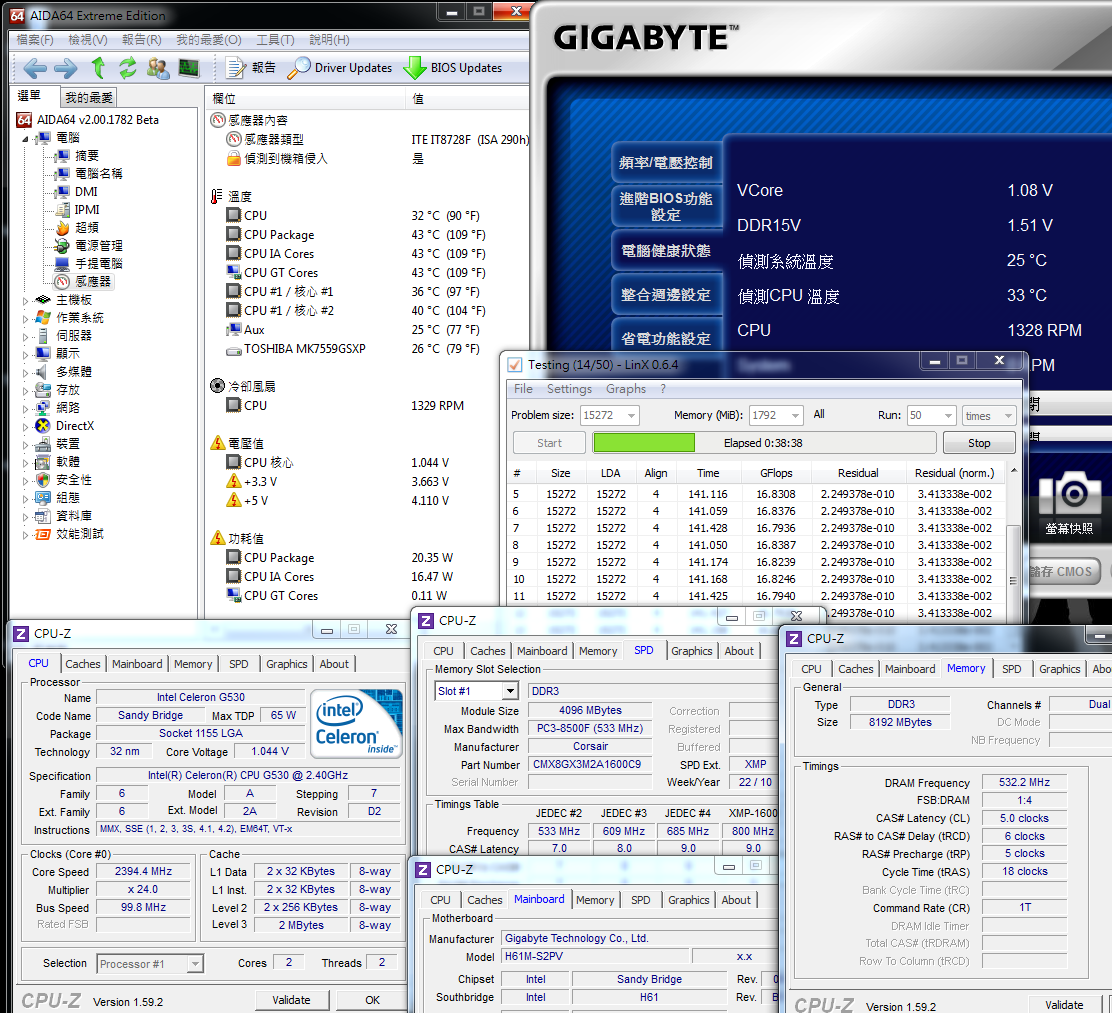
ADIA64 temp is not so accurate. Sometimes, standby and full speed are similar.
Changing to GIGABYTE Touch BIOS software, it’s more accurate.
G530 standby and full speed only 7 degree C difference. Even using hand to touch CPU surface, the heat is low.
G530 and LGA 1156 dual core CPU are both 32nm, but the temp still keeps improving.
Power Consumption
Enable C1E power saving technology. CPU standby 0.86V, full speed 1.08V
Enter to OS Desktop - 22W
Running LinX to full speed CPU - 42W
OCCT Power Supply test (CPU/GPU Full Speed) - 53W
G530 3D performance is far behind G620. However, the power consumption is better.
Standby is only 22W and CPU/GPU full speed is only 53W. Power saving capability is Desktop No.1 so far.
-
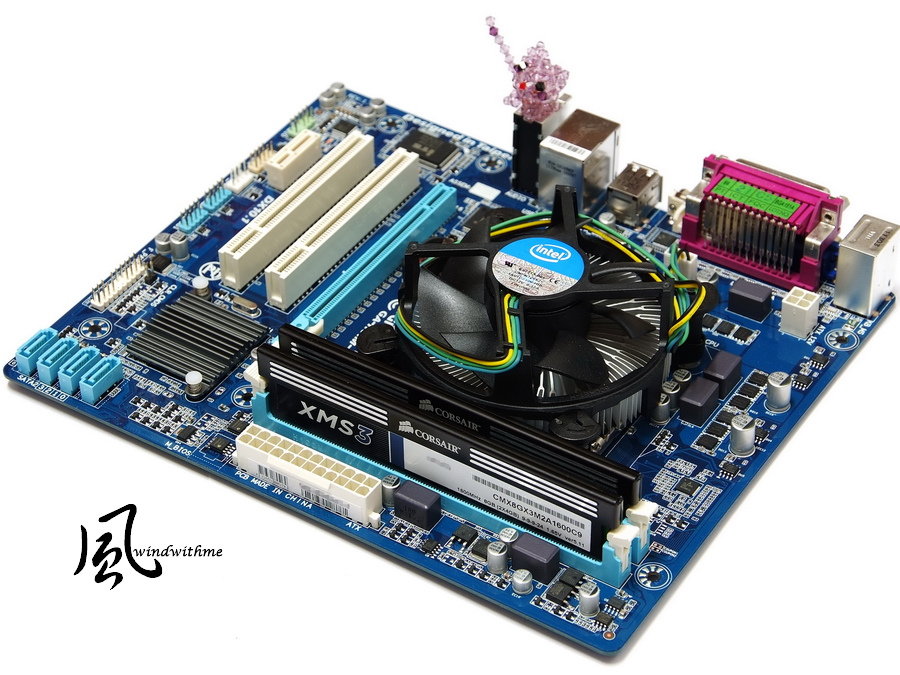
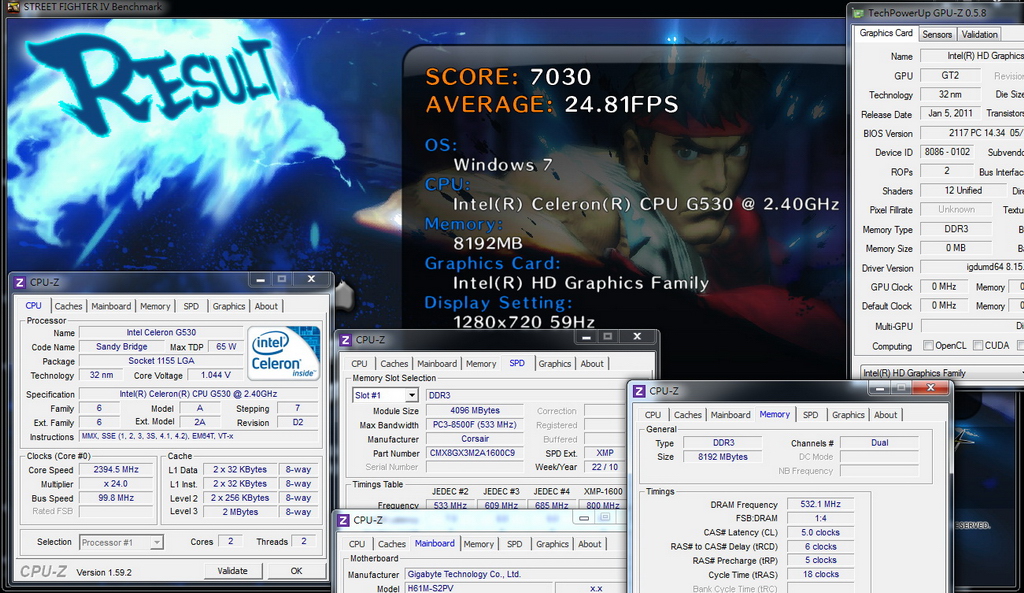
Test Configuration
CPU: Intel Celeron G530
MB: GIGABYTE H61M-S2PV
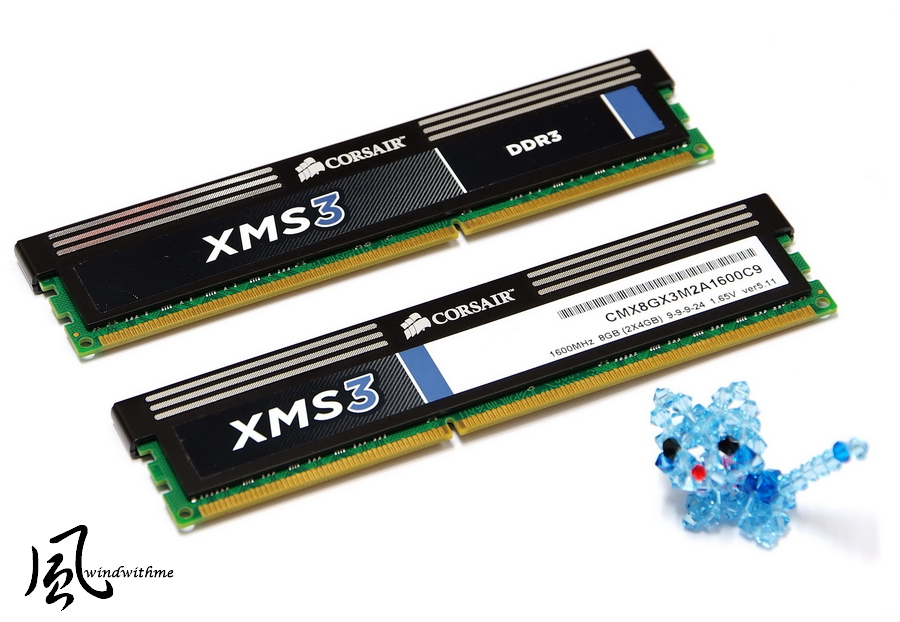
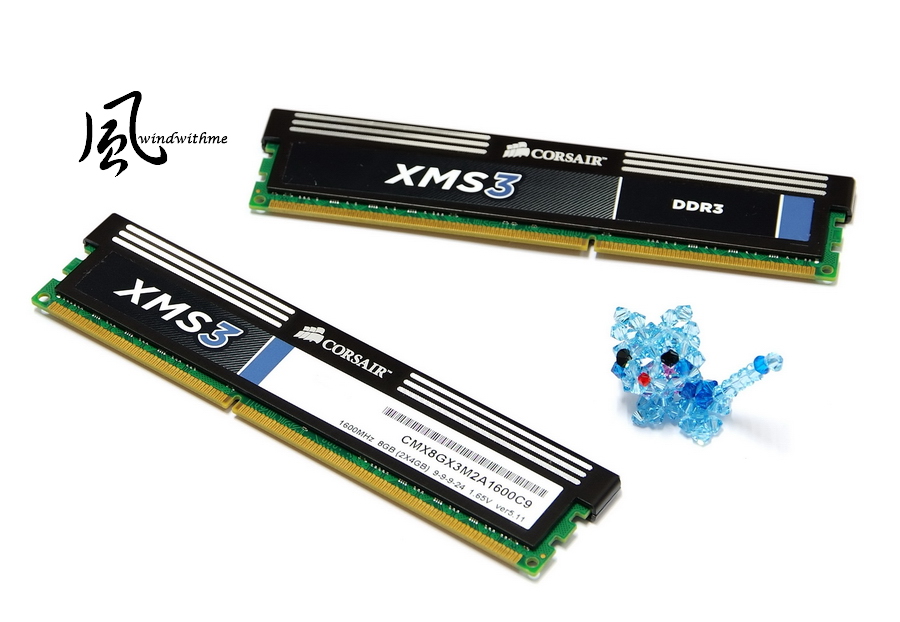
DRAM: CORSAIR CMX8GX3M2A1600C9
VGA: Intel HD Graphics
HD: TOSHIBA 2.5吋 750GB
POWER: SEED V12 400W
Cooler: Intel original cooler
Default Performance Test
CPU 99.8MHz X 24 => 2394.4MHz
DDR3 1064.2 CL5 6-5-18 1T 1.500V
Hyper PI 32M X 2 => 14m 29.420s
CPUMARK 99 => 369
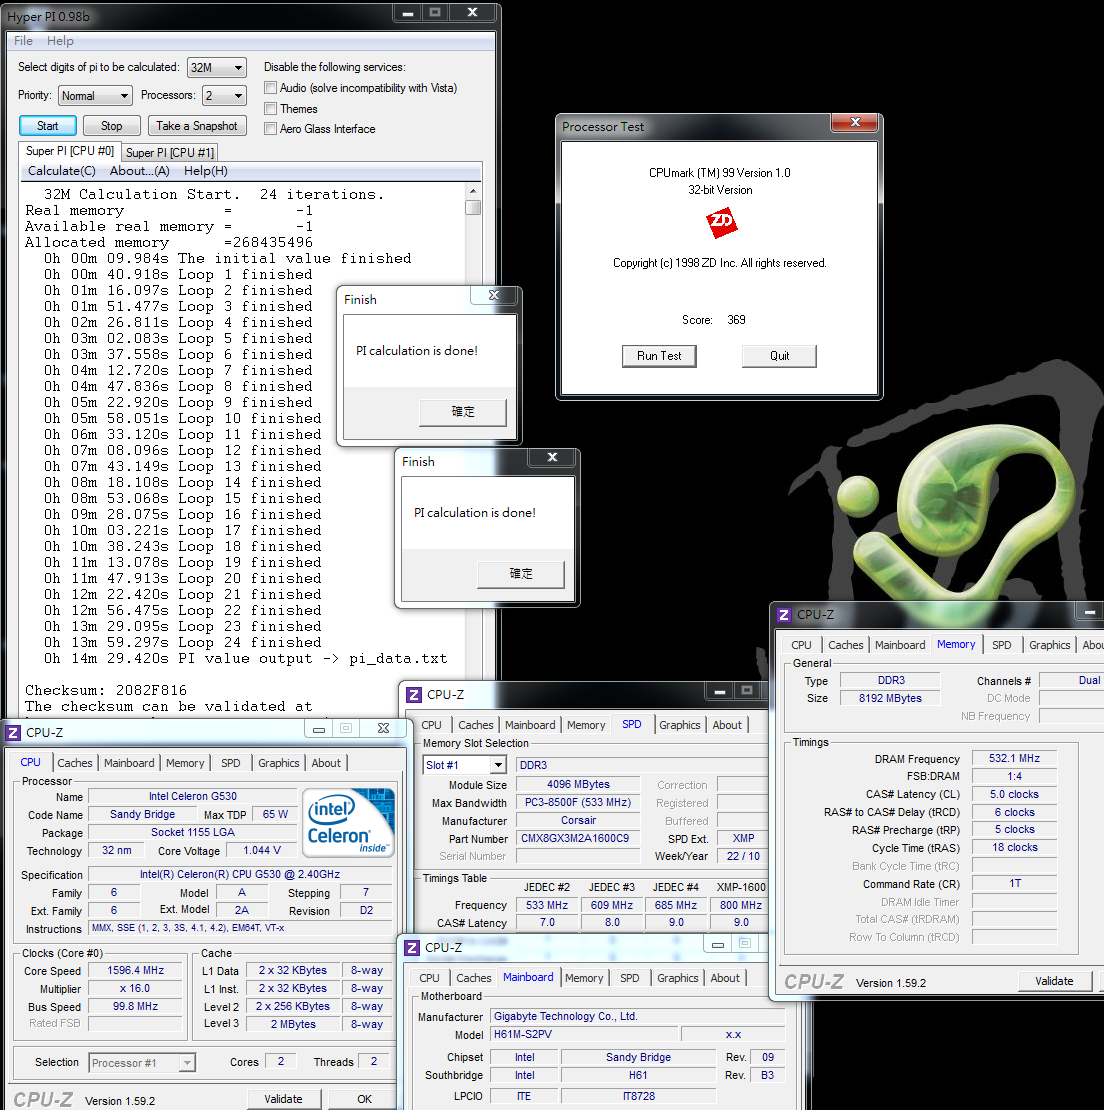
G530 2.4GHz/L3 2MB in single thread performance is lower than G620 2.6GHz/L3 3MB around 8%.
Nuclearus Multi Core => 8315
Fritz Chess Benchmark => 7.33/3518
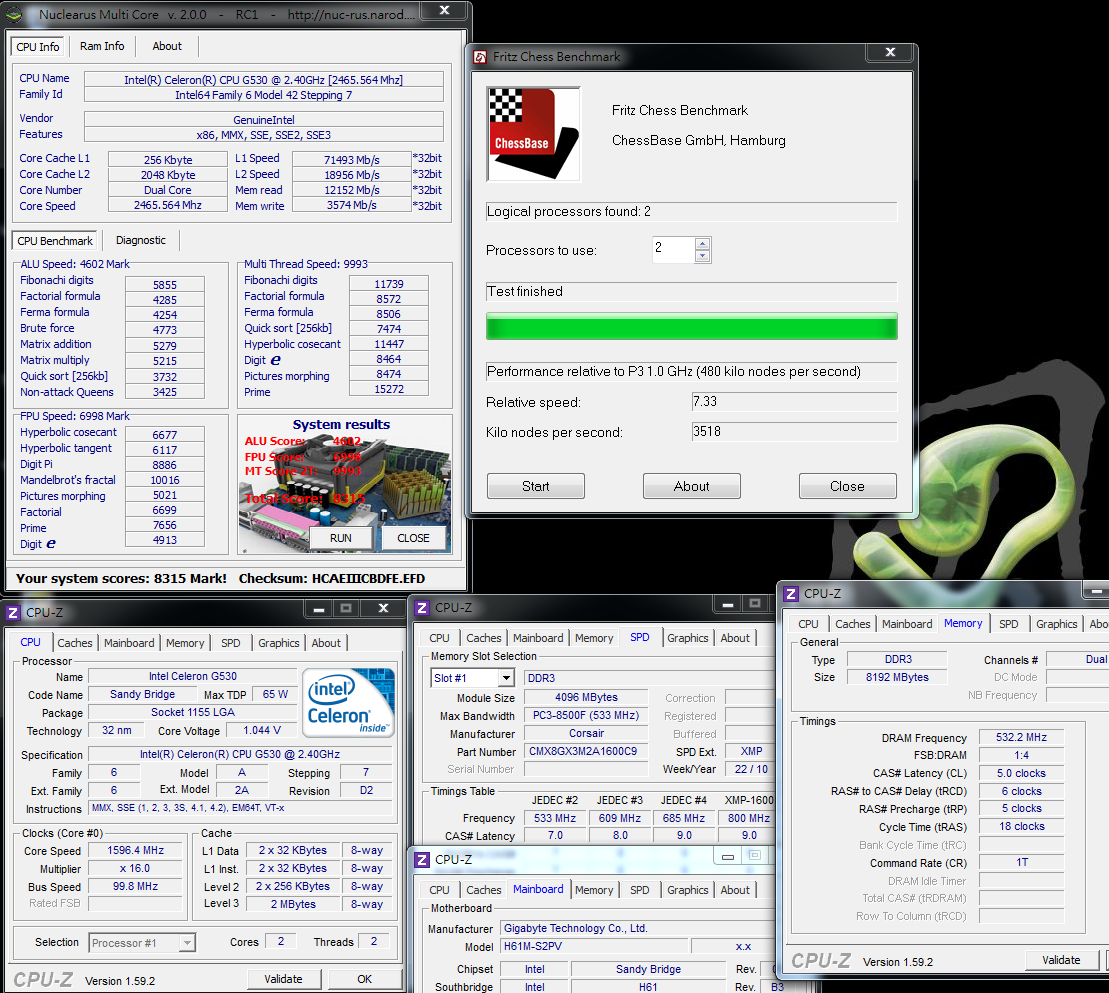
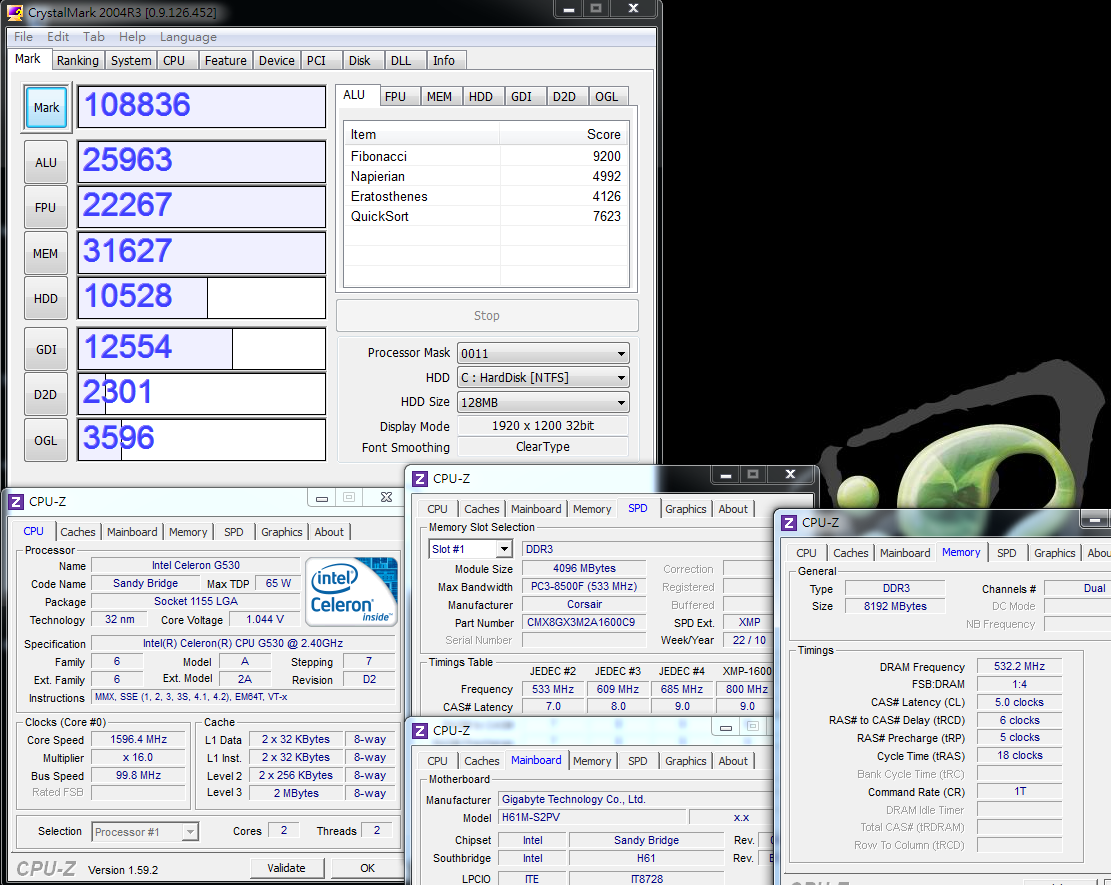
CrystalMark 2004R3 => 108836
CINEBENCH R11.5
CPU => 1.83 pts
CPU(Single Core) => 0.95 pts

G620 single core in CINEBENCH R11.5 is 9.5% higher than G530.
Single thread is 9.8% higher. You can see these two CPU L3 cache don’t impact performance much.
It’s caused by G620 frequency is 200MHz higher than G530.
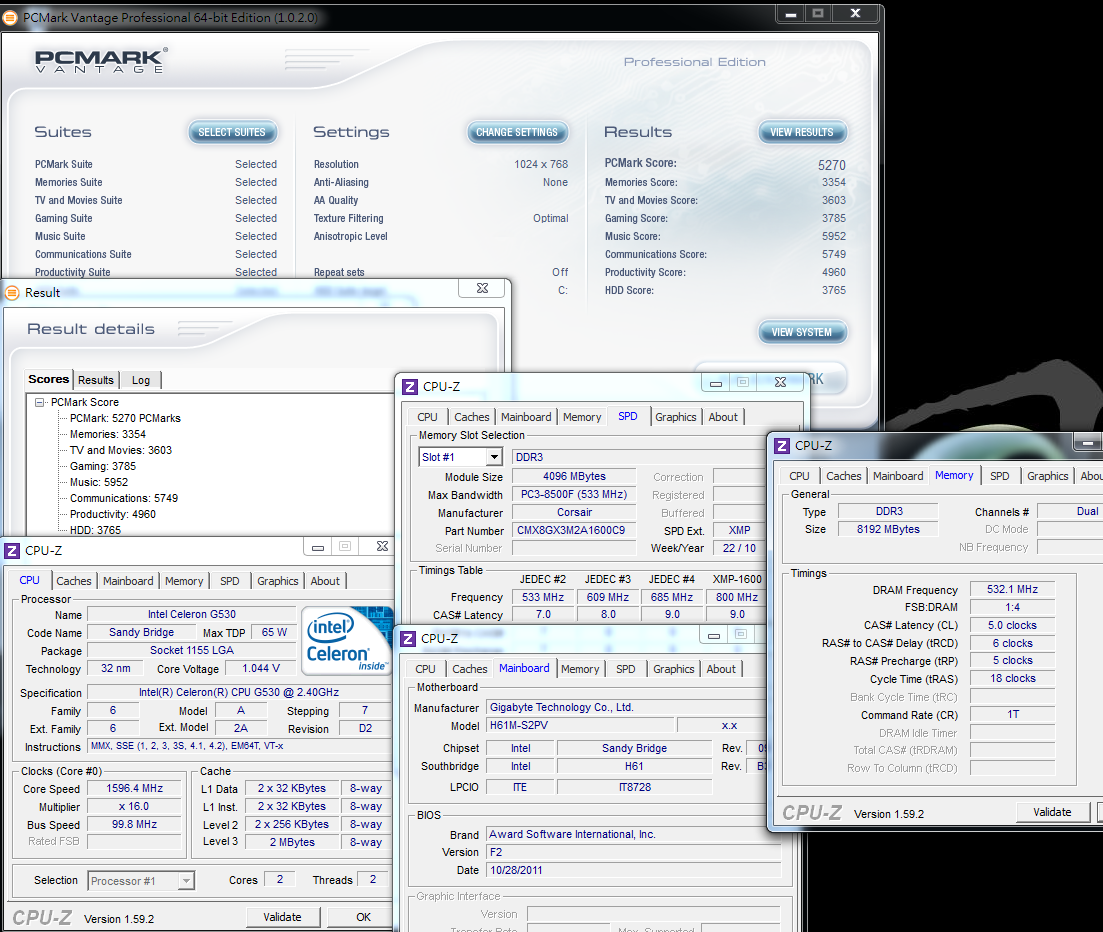
PCMark Vantage => 5270
Windows Experience Index - CPU 6.3

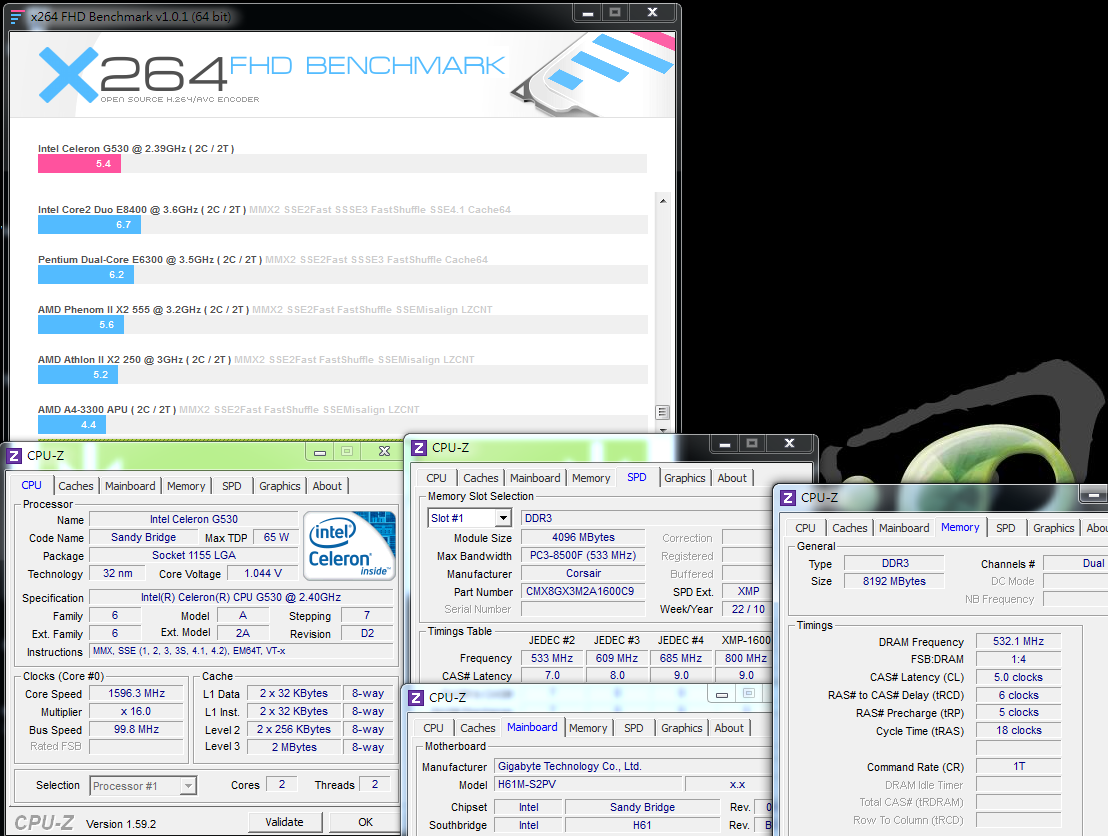
x264 FHD Benchmark => 5.4
G530 is enough for normal application. Single thread is Sandy Bridge strength.
Dual core CPU performance with this price is very high C/P in desktop market.
If you would like to convert file, graphics editing or 3D game, you can choose higher frequency or more cores Intel CPU to enhance the performance.
DRAM Test
DDR3 1064.2 CL5 6-5-18 1T
ADIA64 Memory Read - 12960 MB/s
Sandra Memory Bandwidth - 13675 MB/s
MaXXMEM Memory-Copy - 13700 MB/s

Former LGA 1155 CPU built-in GPU caused lower DDR3 bandwidth.
Sandy Bridge has improved this issue. DDR3 returns to original performance.
DDR3 performance is another LGA 1155 platform strength.
3D Performance
Intel HD Graphics default is 1000MHz
StreetFighter IV Benchmark
1280 X 720 => 24.81 FPS
-
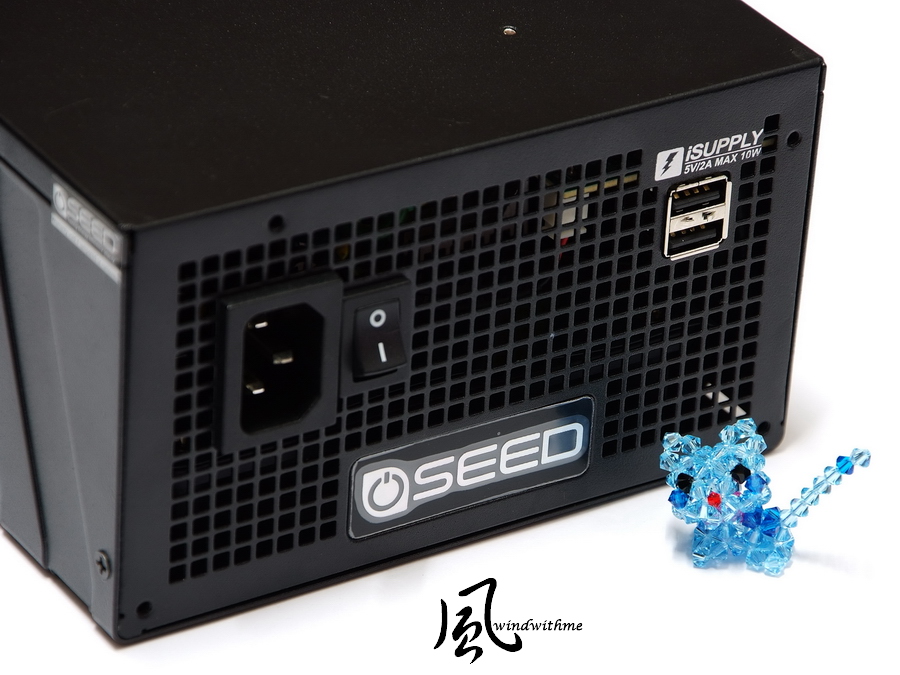
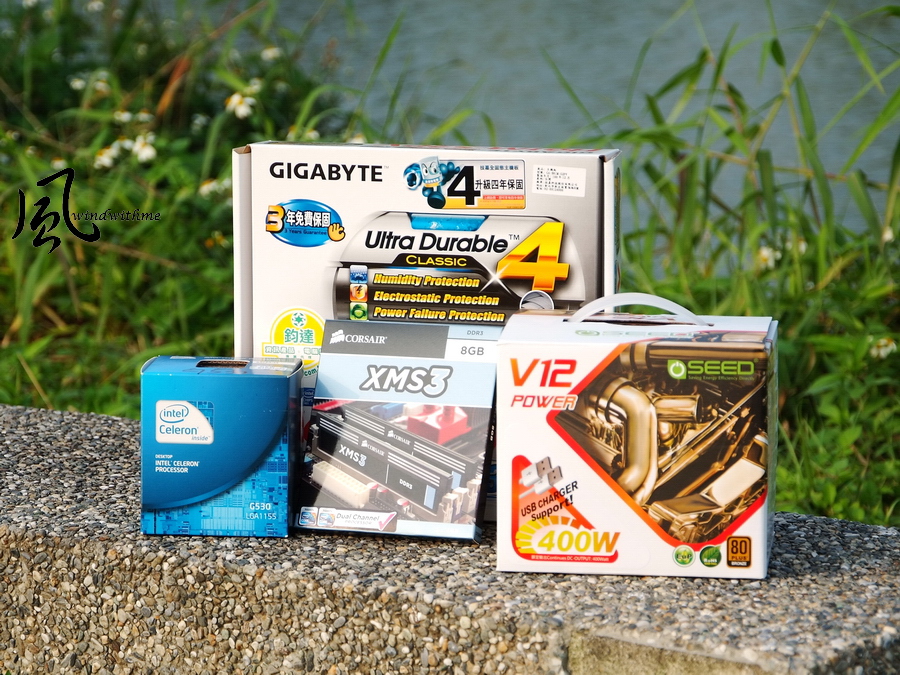
Power Supply
I use SEED V12 400W. V12 and L12 series are SEED new mainstream product line.
This price is around 53USD.
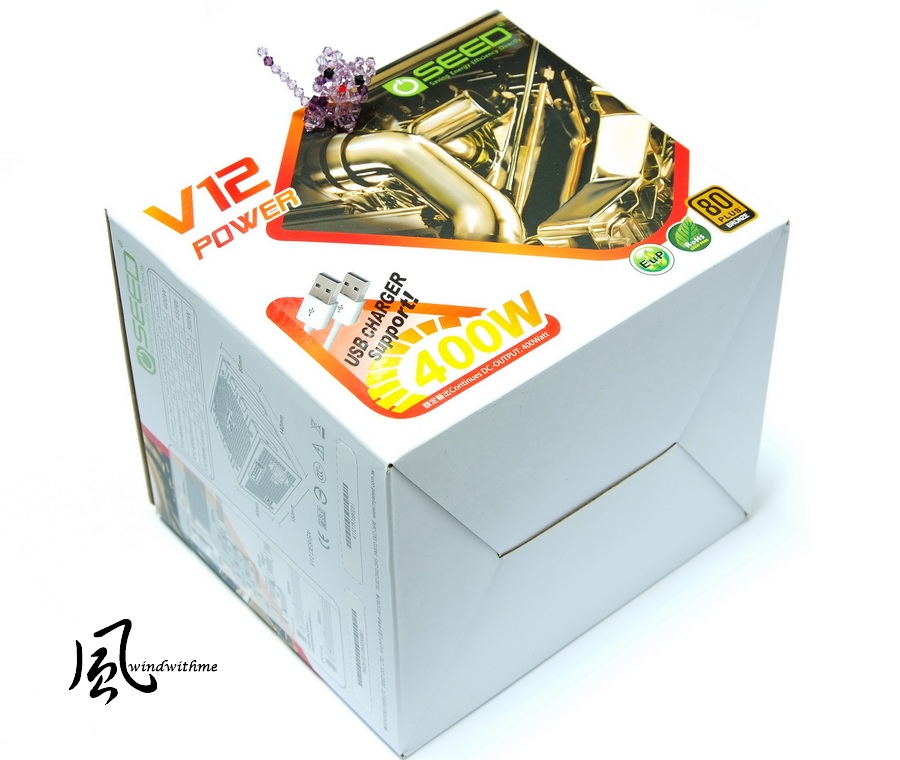
V12 is 80Plus Cooper Certificate. It’s more power saving than L12.
APFC structure with special design shell looks very good quality.
If all cables are wrapped by black plastic, it will be even better.

V12 provides two USB chargers. It’s very convenient for mobile devices power charging.
If your budget is limited, you can useL12 400W, the price is lower.
I think MTBF is also important, so I prefer to use better Power Supply.
Due to Thailand serious flood last year, HDD price went up a lot.
Recently, the price is lower. However, it’s still much higher than original price.
Many users use 2.5” USB HDD to replace as the price is stable.
This is also a way to save money. I use TOSHIBA 2.5” 750GB to test.
Many users have higher confidence performance of Intel brand.
The combination above is not absolute. You also can go for lower spec. one if your performance requirement is not high.
Of course, if you have higher requirement, you can choose higher spec.
Base on your requirement, budget and favorite brands to pick up own combination is the most fun in DIY PC.
BIOS Screen
Main BIOS Tuning Menu, called M.I.T.
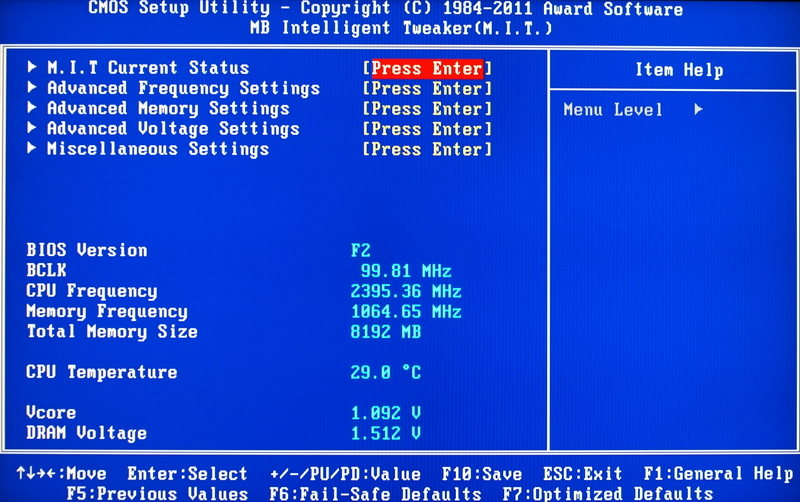
CPU ratio can lower. G530 DDR3 options are 800 and 1066MHz.
Integrated Graphics clock can be higher to increase IGP 3D performance.
DRAM Features

Advanced setup, I set it as CL5 6-5-18 1T to enhance bandwidth.
I also tried other entry DDR3 1333, but cannot run well in above CL.

Voltage Page
Dynamic Vcore(DVID) -0.320~ +0.640V
Graphics DVID -0.200~+4.80V
DRAM Voltage 1.100~2.400V
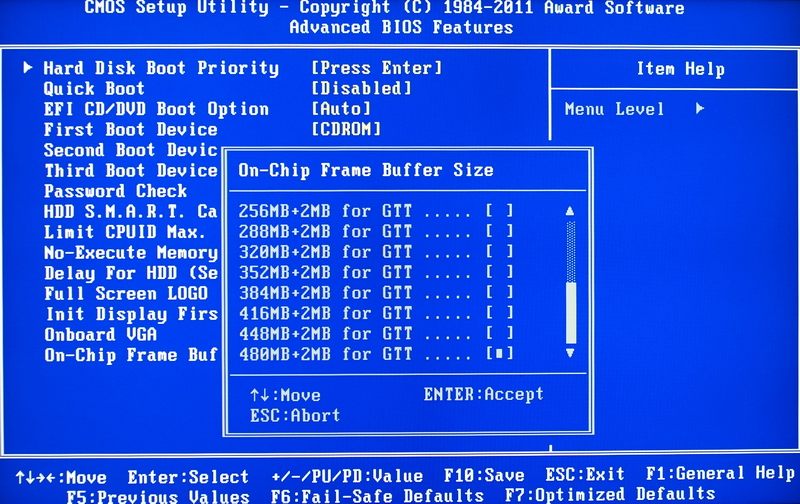
I set GPU shared memory to 480MB+2MB.
PC Health Status
G530 C/P value is quite good for non-OC users.
For higher performance requirement, you can change by your demand.
H61M-S2PV can be OC to enhance GPU performance and lower CPU voltage to save power.
BIOS is still not UEFI, but traditional interface is faster and more stable.
-
Entering 2012, following up is Chinese New Year. This year is most popular year of Chinese, Dragon Year.
Looking back the market last year, DIY PC became smaller due to light users who just need internet surfing or use easy apps, moved to Notebook, tablet or Smart Phone.
Even though, Desktp still has good performance, better audio/video, and upgradability.
For office or students, it’s more suitable for word processing and Online Game.
Desktop PC is still the highest C/P option for larger size monitor and making long time usage more comfortable.
This is windwithme annual entry PC sharing.
Last year, I shared AMD first. This year, I go for Intel first.
Sandy Bridge CPU launched cheaper Pentium and Celeron series.
H61 MB price is lower than H55 due to MB makers tough competition.
LGA 1155 CPU plus MB can save much money. Maybe this is the price strength caused by smaller DIY market.
CPU Processor
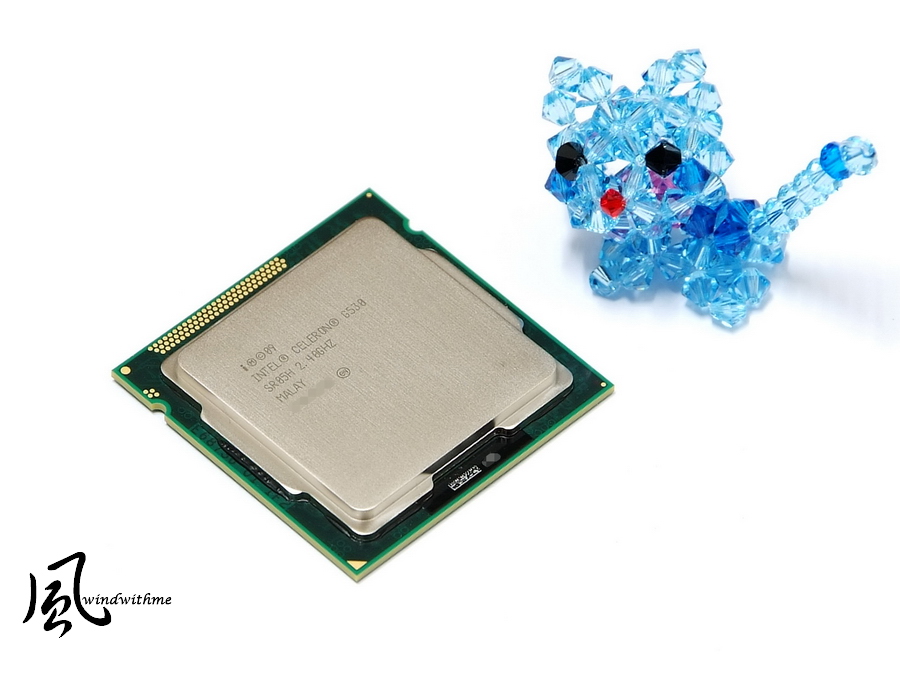
Inte Celeron G530, just launched last Sep.
2.4GHz, 32nm, 2MB L3 cache, D2 Revision
Physical 2 Cores without Hyper-Threading supports max 2 threading, called 2C/2T.
Price is around 47USD.

Contents
Product manual, original cooler, Intel Celeron G530 CPU
Even it’s Celeron naming, Sandy Bridge G530 performance is not bad.
LGA 1155 Pentium L3 cache is 3MB. This is the main difference of Intel new generation CPU.
MB
Currently, Intel most popular integrated video output chipset is H61 for entry or Z68 for high end.
There are many H61 models in the market. You can find plenty features and specs.
I pick H61 mid-range GIGABYTE H61M-S2PV. It’s around 70USD.
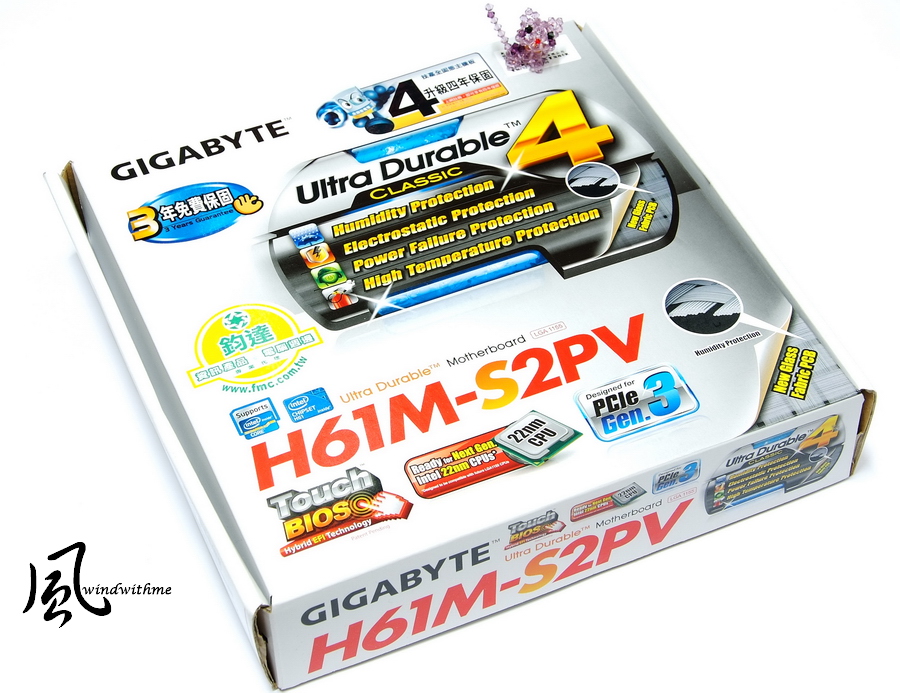
GIGABYTE H61M-S2PV main feature is Ultra Durable 4.
Glass Fabric PCB technology, anti-surge ICs, Physical dual BIOS,
ICs with up to 3 times the ESD resistance levels, 100% solid caps and Lower RDS(on) MOSFETs

Even though there are lower price H61 models, I prefer to have PCI and DVI on board.

DRAM
DDR3 price is lower and lower. 2GBx2 is only for tight budget users.
Windows7 64-bit is getting more popular, 4GBx2 becomes mainstream spec.
I use CORSAIR xms3 4GBX2 dual channel version. 1600 version price is a little bit higher.
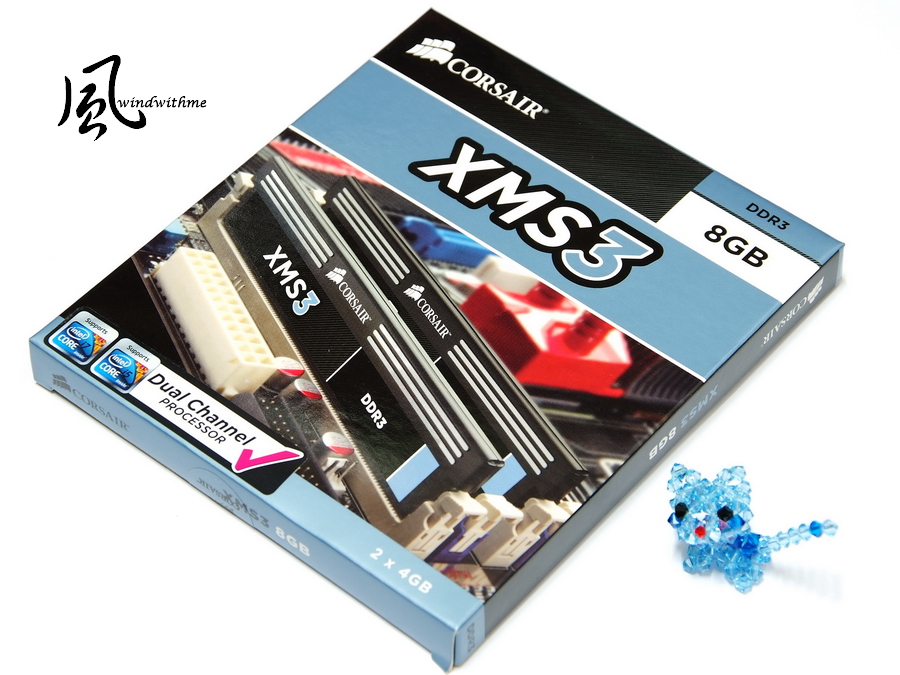
CORSAIR is international well-known brand and its stability test procedure is very strict. The price is acceptable range.
This model price is around 50USD.
Celeron G530 with H61 only support DDR3 1066. It’s still slower than entry DDR3 1333.
If you use higher frequency DDR3, you can enhance CL in 1066 to rise the bandwidth.
For budget concern or no heatsink requirement, you can just pick entry DDR3 1333.
-
Last, under the same room temperature 21℃ and over-clocking of CPU OC 4.7GHz, the temperature of MOSFET is measured by temperature-measured software.
The performance is pretty good compare to others X79- standby 44.7℃ and burning 83.6℃,
which is contributed to heat sink since most of X79 motherboards will over 80℃ while over-clocking.
I personally suggest emphasizing heat dissipation when over-clocking.
The following product review of X79 will also measure the temperature of the hardware as reference.
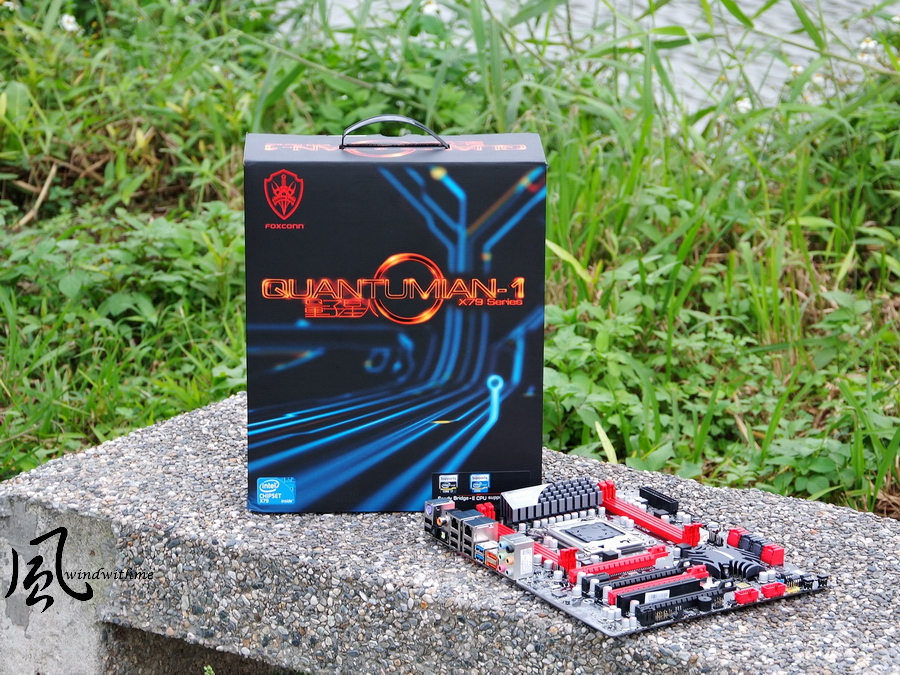
FOXCONN Quantum Force QUANTUMIAN1
Pros
1. Quantum Force possesses artistic exterior packing and high-end standard materials
2.Japanese 100% solid capacitor embedded POWER/RESET/CMOS Reset button and debug light.
3. Up to 4 X PCI-E X16 which effectively level up 3D performance.
4. Outstanding over-clocking performance which only requires 1.286V when 4.7GHzand DDR3 2400
5. Special OC Switch Button design to directly provide over-clocking request.
6. Dual gigabit LAN, 2xeSATA and PWM 14-phase
Cons
1. To suggest add the selection of DRAMIT in BIOS
2. To install the current trend of motherboard market-UEFI BIOS
3. To improve the FOXCONN MB brand visibility and channel
Performance ★★★★★★★★★☆
Material Usage ★★★★★★★★☆☆
Specification ★★★★★★★★☆☆
Appearance ★★★★★★★★★☆
Price/Quality ★★★★★★★★☆☆
It has been 3 years for Intel to update the previous high-end product line X58 chipset of LGA 1366.
It is expected that the structure of LGA 2011 would be market for at least 2-3years which is longevity than Intel lower-end product line.
However, theoretically, high-end chipset performs much better than others.
Quad DDR3 and the bandwidth of Dual PCI-E X13 are the most featured strengths.
Besides, CPU supports 6C12T which is lack from middle-end LGA1155.
Though X79 belongs to high-end product line, it segmented by entry level, middle-end and high-end based on price.
The price of FOXCONN QUANTUMIAN1 is around USD$275 which possesses the entry price of X79 but performs as same as middle-end X79, USD$330.
It indirectly promotes the C/P of QUANTUMIAN1.
QUANTUMIAN1 performs quiet outstanding. CPU 4.7GHz / DDR3 2400 could be achieved by stable voltage.
Besides, it is a steal to have 4 X PCI-E X16 under this price. On top of that, the color and materials of motherboard meets the standard of high-end product line.
It would be better if BIOS update could add UEFI interface and 1T selection in the near future.
In recent years, the selectable motherboard brands become less and less.
It would be great if FOXCONN could continuously roll-out more Quantum Force product line and to have more products to support more models.
To populate more high-end and various FOXCONN product line would provide numerous benefits for hard-core users.
This article is also post in my blog WIND3C, Any comments are welcome.
-
3D test
msi N560GTX-Ti Twin Frozr II
3DMark Vantage CPU SCORE => 91380

FINAL FANTASY XIV
1920 X 1080 => 4707

StreetFighter IV Benchmark
1920 X 1080 => 305.85 FPS

The scores of 3DMark Vantage on CPU SCORE is incredible high, it’s contributed by Intel 6C12T without question.
Other 3D Game test software do not take many advantages on multiple cores, they would get higher scores based on CPU.
Basically, it’s rarely for game to support up to CPU of 4 cores therefore the rendering ability of CPU structure is highly important.
Power Consumption test
There is no required software to open CIE power saving technology, 77W, under OS desktop.

There is no required software to open CIE power saving technology, 177W, under OS desktop.

To operate LinX to full speed CPU - 364W

The power consumption of 3960X 6C12T CPU over-clocking 4.7GHz
It is more to say that C1E is a outstanding power saving choice, which you can save around 100W when you open C1E technology under stand by mode.
The power consumption when the CPU full speed is 364W which is no difference compared to the previous combination of X58 and 980X OC 4GHz.
The above theory is as same as high-end VGA. The next high-end VGA generates much more performance but with no difference on power consumption compared to the previous same product level.
It is proved that Sandy Bridge-E possess higher clock and more progress on power saving.
Temperature (Room temperature is around 21℃
When system standby- 33~37
To operate LinX to full speed CPU - 61~66
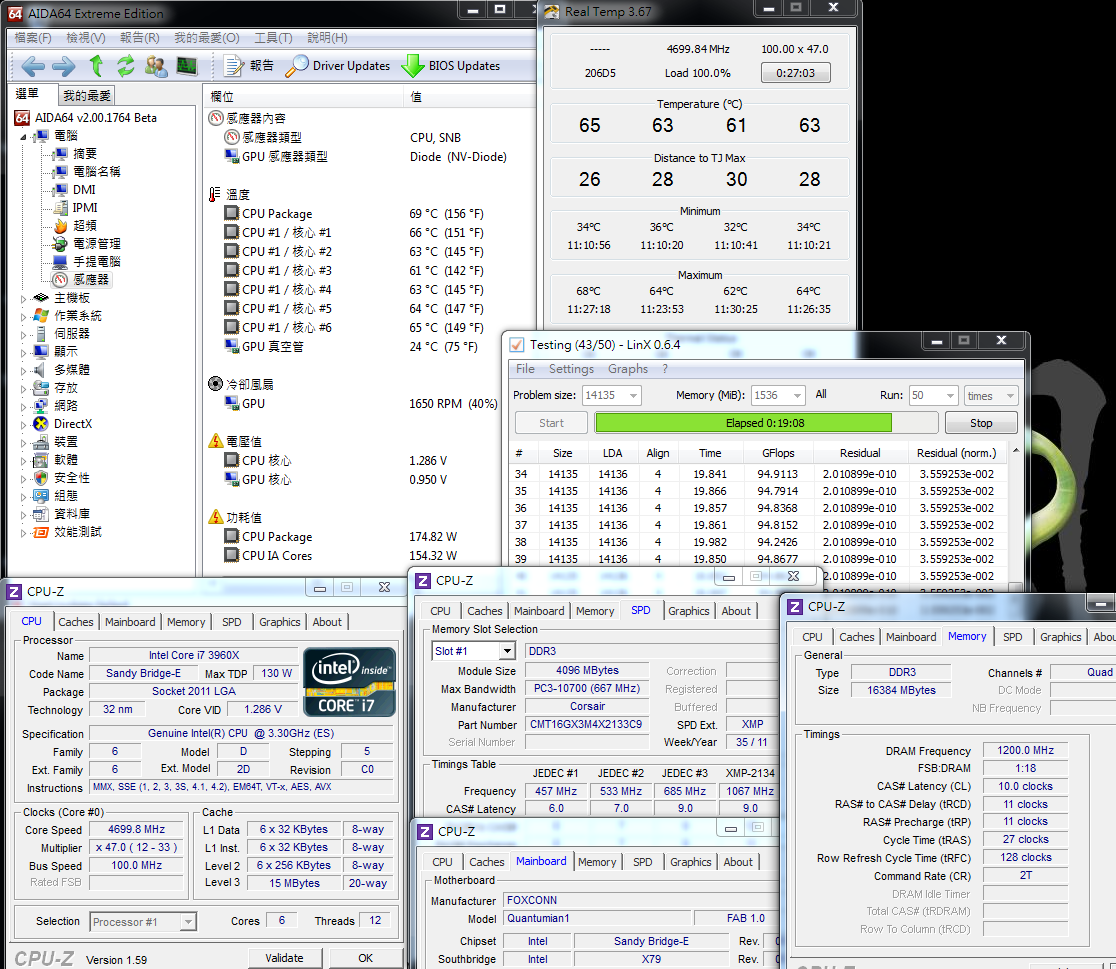
One minute afte the end of LinX operation - 36~38

Core i7-3960X is the highest Intel CPU specification. It’s suggested to use much higher-end cooler under over-clocking.
The temperature performance of both standby and full speed under OC4.7 GHz over-clocking is quiet excellent.
In order to avoid the gap between the temperature-measured software and actual temperature, the heat pipe of water cooling is just warm but hot.
Whether you are using CORSAIR Hydro Series H80 water cooling when test or CPU high-end cooler,
when CPU is extreme over-clocking, it is the one and only way to pay attention to thermal.
-
Installable application software
Too bad that there is no AEGIS PANEL software

Over-clocking testing
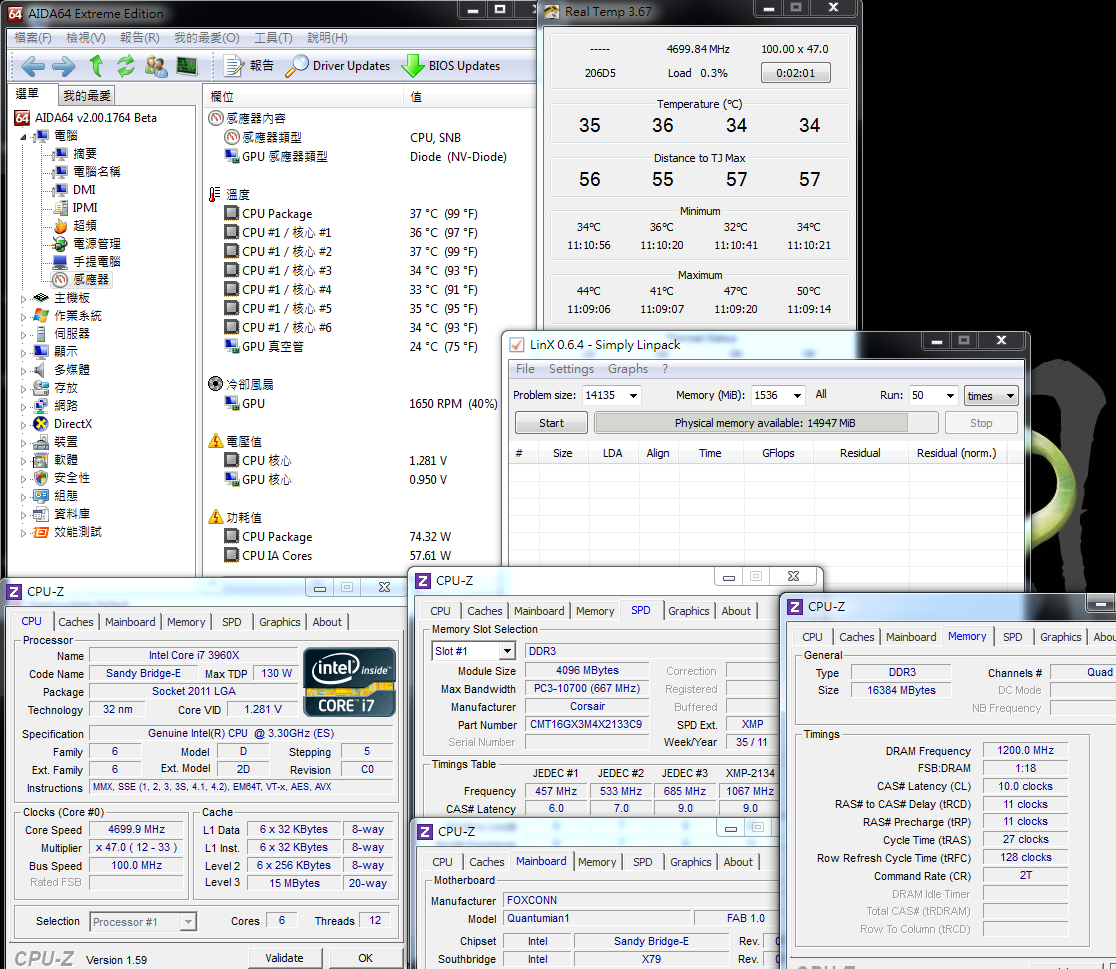
CPU 100 X 47 => 4700MHz 1.286V
DDR3 2400 CL10 11-11-27 2T 1.55V
Hyper PI 32M X 12 => 11m 39.521s
CPUMARK 99 => 719
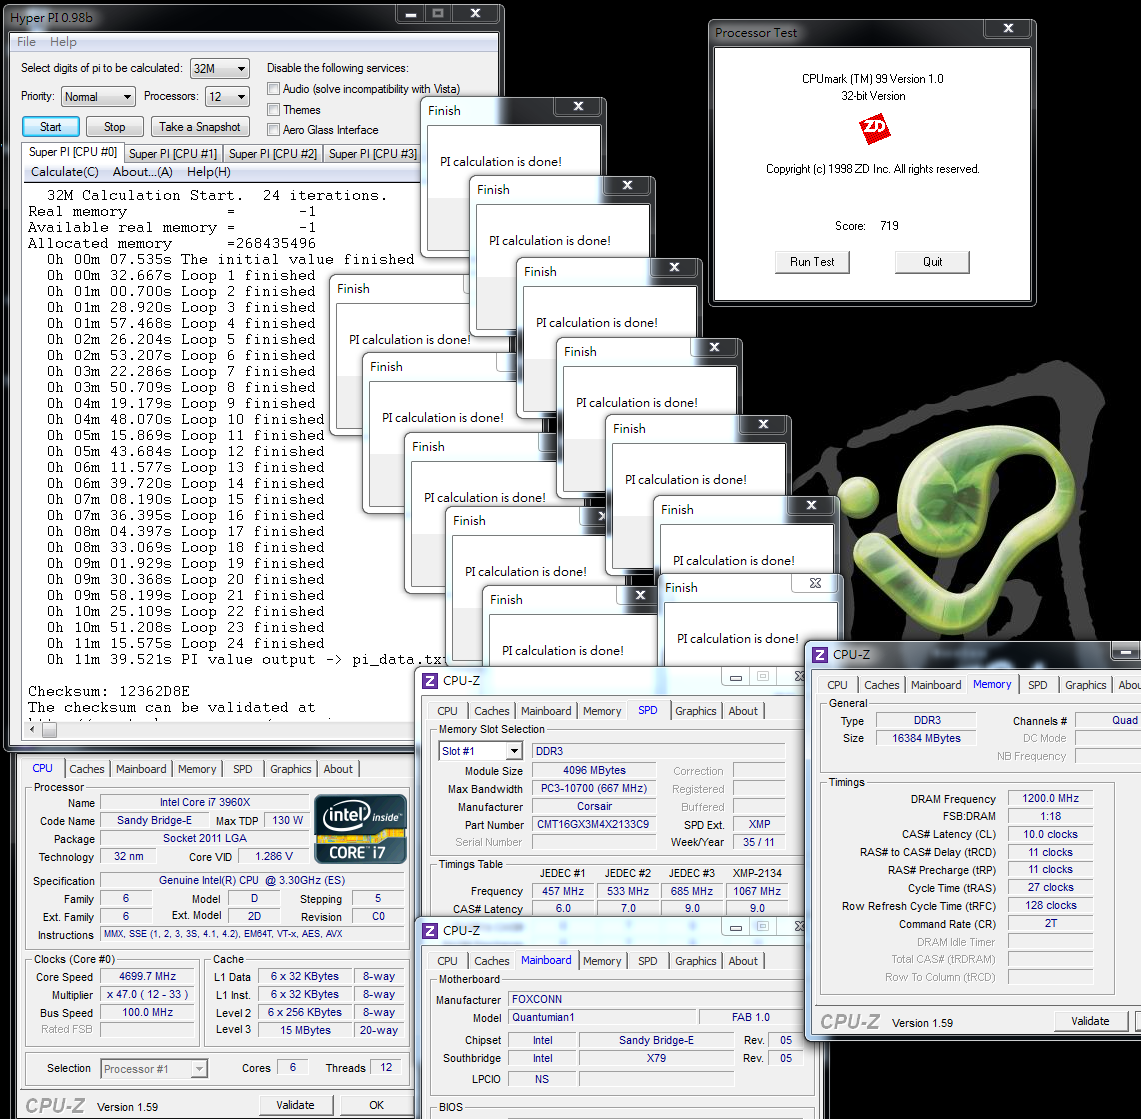
x264 FHD Benchmark => 37.6
Fritz Chess Benchmark => 52.36/25134

CrystalMark 2004R3 => 464186
CINEBENCH R11.5
CPU => 13.74 pts
CPU(Single Core) => 1.90 pts

PCMark Vantage => 28771

It only requires about 1.28V of 3960X OC 4.7GHz to steadily operated above testing software.
Since the thread of Sandy Bridge-E3960X/3930K is up to 6C12T,
above testing performance is higher than 50% compared to 2600K /2700K 4C8T under the same clocking,
which is at the same time one of the featured highlight even though the price of CPU is higher than the market.
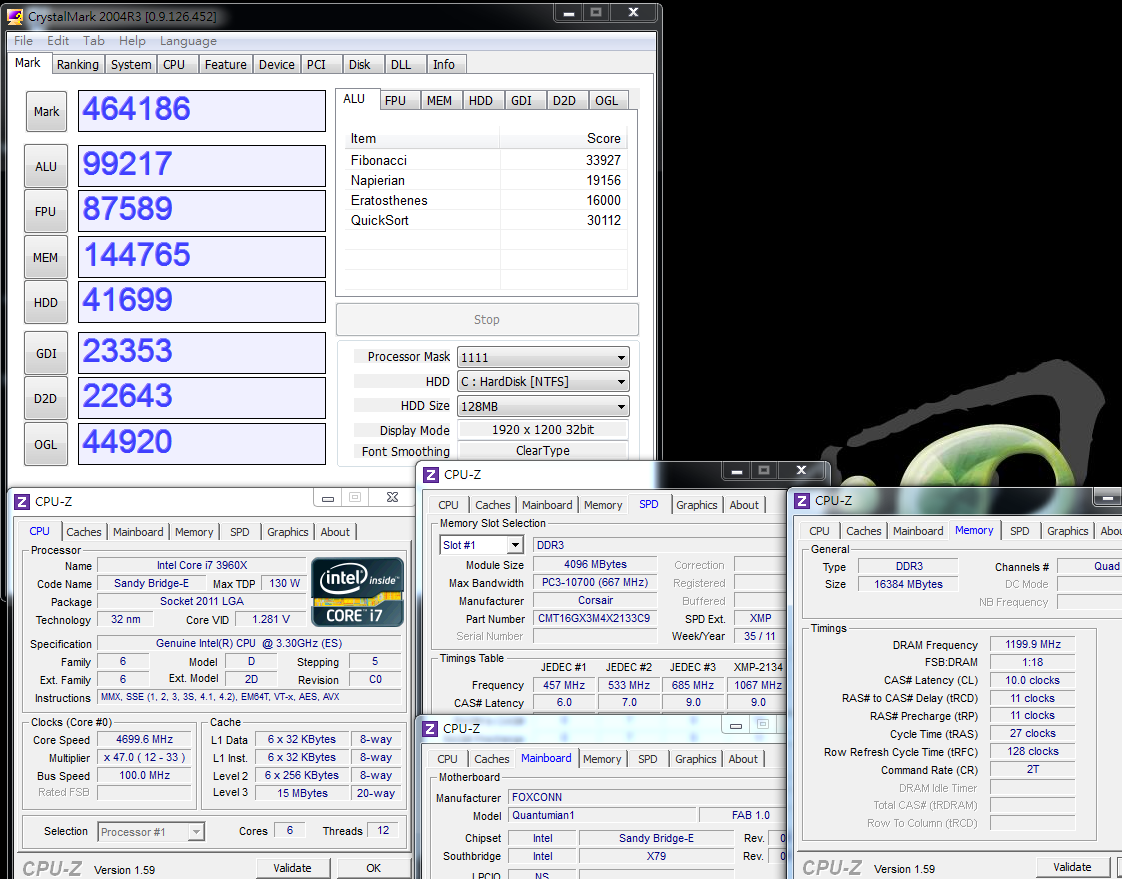
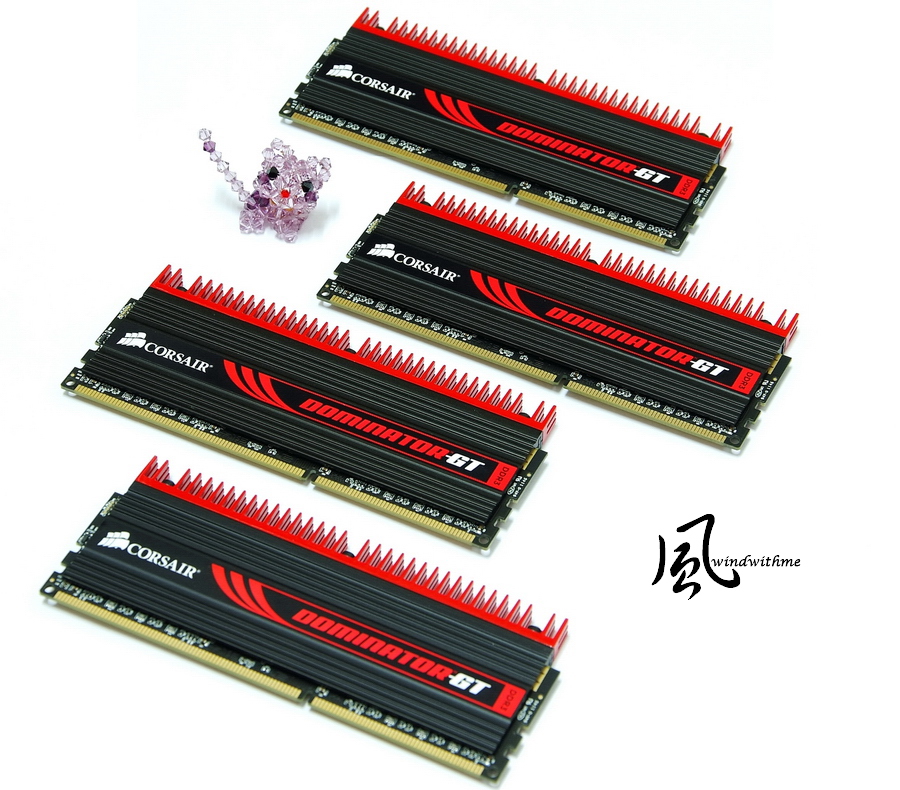
DDR3 is using the United States CORSAIR high-end DOMINATOR-GT series, which the style# is CMT16GX3M4X2133C9
Clock is 2133、parameter is CL9 11-10-27 1.50V,capacity is 4 X 4GB

Quad channel DDR3 chipset is another X79 primary featured new technology which first one ever supports DeskTop.
It supports the latest 1.3 version at Extreme Memory Profile(XMP) automatically over-clocking.
In other wards, you would not able to enable XMP if your DDR3 is not the latest XMP 1.3version.
To enable XMP DDR3 2134.4 CL9 11-10-26 2T test
ADIA64 Memory Read - 21702 MB/s
Sandra Memory Bandwidth - 50428 MB/s
MaXXMEM Memory-Copy - 17733 MB/s
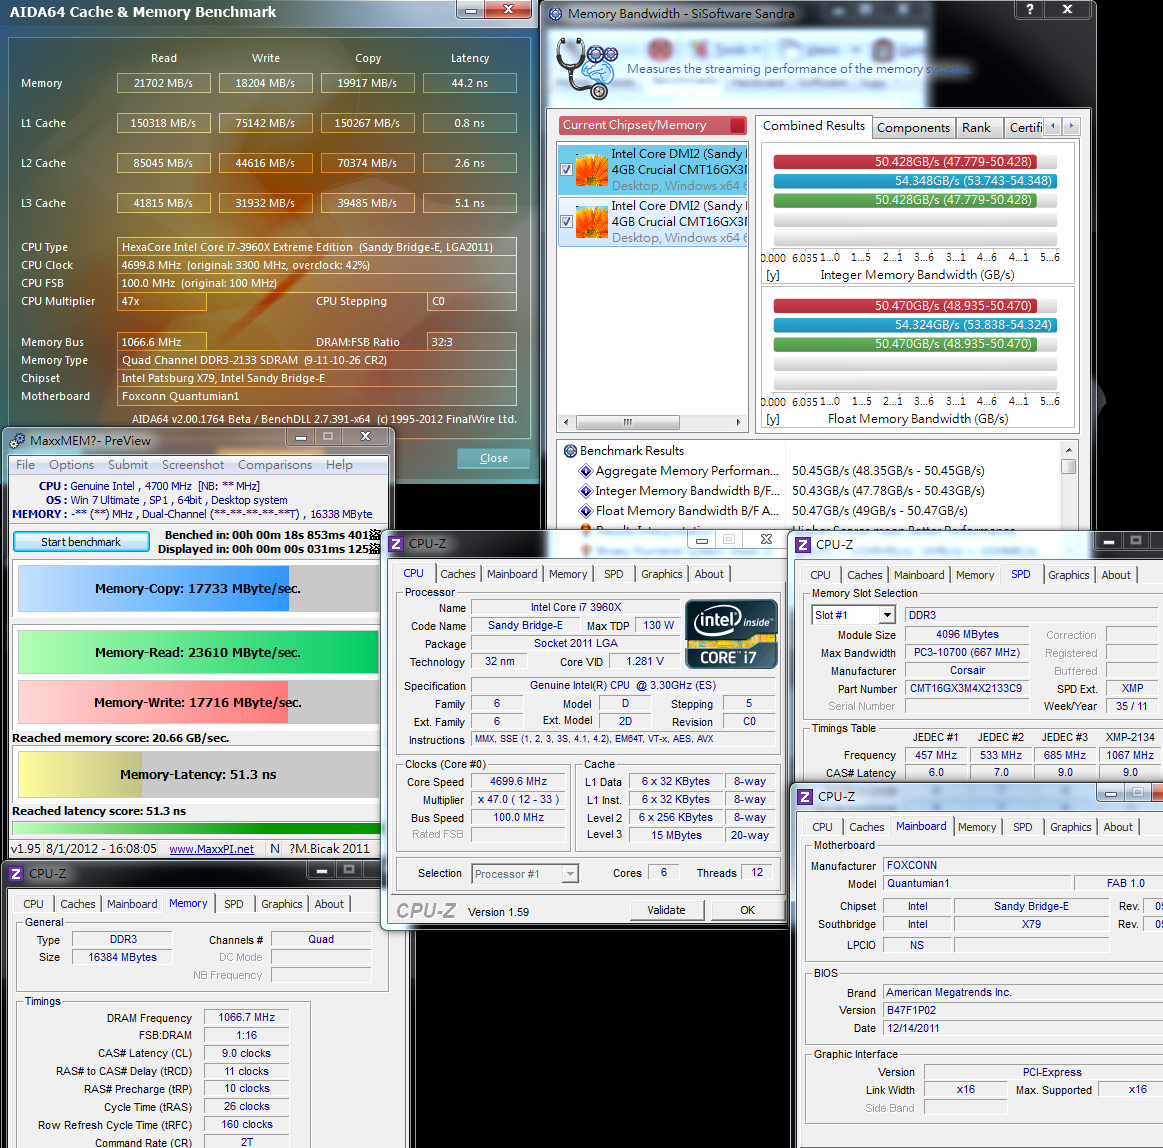
Over- clocking DDR3 2400 CL10 11-11-27 2T 1.55V
ADIA64 Memory Read - 22692 MB/s
Sandra Memory Bandwidth - 54348 MB/s
MaXXMEM Memory-Copy - 18144 MB/s

Both ADIA64 and MaXXMEM do not make any obvious effort under the structure of Duad channel;
however the memory bandwidth of Sandra and above test CrystalMark is higher than two times than LGA 1155 platform.
It seems the software technology of supporting quad channel will plays an critical role on performance gap of DDR3.
CORSAIR DOMINATOR-GT could steadily up to DD3 2400 under QUANTUMIAN1 default voltage.
The performance of over-clocking is pretty amazing, which is partly contributed to the scope of over-clocking of DDR3 in X79 chipset.
-
BIOS Main
FOXCONN hasn’t imported UEFI interface which is much more artistic and controlled by mouse compared to traditional BIOS.
However, it takes time to power on and the frequency of crash shutdown is comparably high.

Quantum BIOS
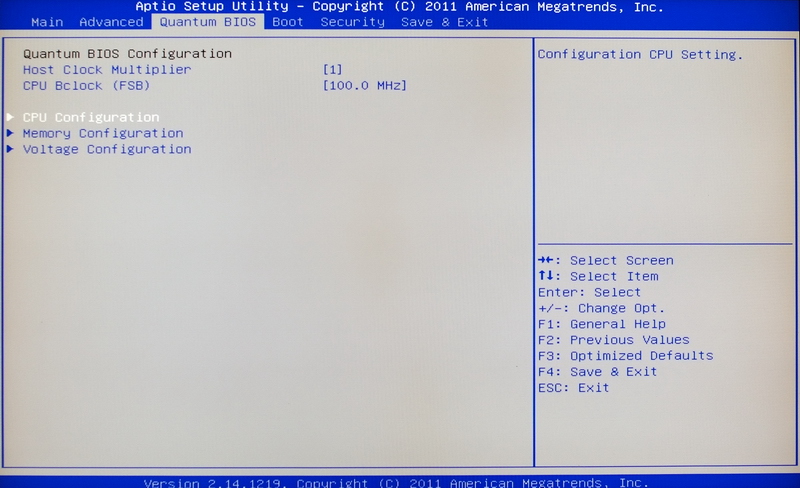
CPU selection menu
When over clocking, if you don’t CPU clock to be fluctuated downwards, you need to adjust the following selection.
CPU C1E Enhanced Halt State closing
To higher IA Core Current MAX and Power Limit 1/2 Value, the following example is to adjust to 2000

Power Technology is requested to be closed so that CPU clock won’t be fluctuated when over-clocking above 4.5GHz
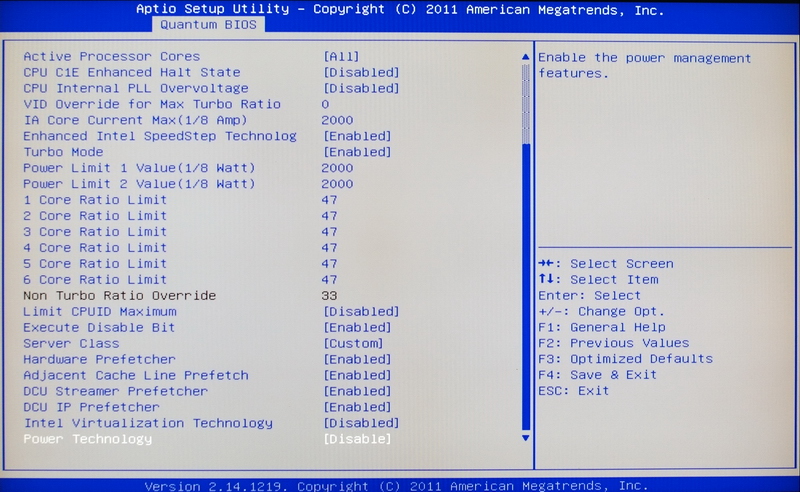
DDR3 parameter setting selection which provided various DRAM to slightly adjust parameter and steadily utilize it.
The following setting is DDR3 2400 CL10 11-11-27 2T
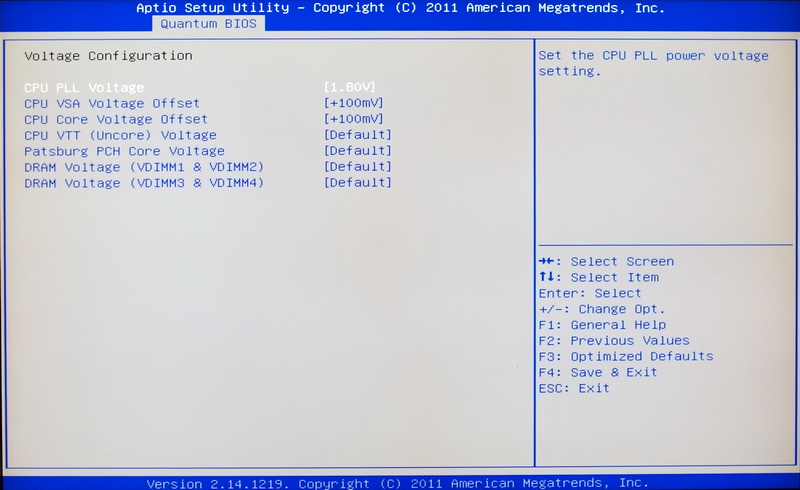
Voltage menu
CPU PLL Voltage 1.80~2.43V
CPU VAS Voltage Offset +10~+630mV
CPU Core Voltage Offset +10~+630mV
CPU VTT (Uncore) Voltage 1.005~2.011V
Patsburg PCH Core Voltage 1.005~2.011V
DRAM Voltage (VDIMM1 & VIDMM2) 1.005~2.307V
DRAM Voltage (VDIMM3 & VIDMM4) 1.005~2.307V
Hardware Monitor

Above is the over-clocking of both raising CPU multiplier and DDR3 clock.
The voltage of both CPU and DDR3 has to be paid attention and so as the optimal of DDR3 parameter.
If you want to over-clock to above DDR3 2133, except for DDR3, CPU VAS Voltage Offset plays another critical role.
Voltage+100mV has to be setup. Above is the over-clock setting by windwithme, which is the reference for x79 platform.
Testing platform
CPU: Intel Core i7-3960X
MB: FOXCONN Quantum Force QUANTUMIAN-1
DRAM: CORSAIR DOMINATOR-GT CMT16GX3M4X2133C9
VGA: msi N560GTX-Ti Twin Frozr II
HD: CORSAIR Performance Pro Series 128GB
POWER: Thermaltake Toughpower Grand 1200W
Cooler: CORSAIR Hydro Series H80
OS: Windows7 Ultimate 64bit

FOXCONN software setup menu
Full screen and outer space background are shown up after power on.
-
Ever since Intel officially launch Sandy Bridge-E new platform in 2011 November,
several motherboard companies successively roll out new motherboard based on X79 chipset to support Intel next generation high-end platform.
Due to the continuous effort of self-own brand management made by FOXCONN, Quantum Force series still dominant high-end motherboard.
FOXCONN X79 QUANTUMIAN1 still provides various choices for the market though the quantities of Quantum Force series are not as various as they are in the past time.
Soon after the release of Intel X79 chipset, FOXCONN promptly roll out corresponding X79 motherboard.
Quantum Force was naming in a special way which the Intel code won’t be shown on the models.
This time, QUANTUMIAN1 which belongs to the series of Quantum Force still follows the high-end style both in material and design.
The patterns shown on exterior packing of high-end product are always different which exhibits the great efforts on art design.

The full picture of FOXCONN QUANTUMIAN1
Quantum Force is common to use black and red to create contrast visual sense.
Currently, there are more and more motherboard brands adopt these two colors to match.

It is known that the market segment of QUANTUMIAN1 X79 is positioned as high-end product line.
Besides, the corresponding specification, design and featured over clocking function have also been highly highlighted.

Accessories
Product manual, easy guide, nVIDIA SLI 3Way bridge, CD and IO shield

SATA connectors and cables both in red and yellow
DC power cable SATA

The lower left side of motherboard
4 X PCI-E 2.0 X16,supports 4Way CrossFireX / 3Way nVIDIA SLI
Bandwidth X16+X8+X16+X8,PCI-E slot is using X16
1 X PCI-E X1
1 X PCI
Dual Gigabyte Lan, Realtek 8111E and Intel 82975V
Audio, Realtek ALC892, supports up to 7.1 channel and High Definition Audio

The lower right side of motherboard
2 x red SATA3, provided by x79 chipset
4 x black SATA2, provided by x79 chipset
Above could mix to establish RAID0, RAID1, RAID5 and RAID 10.
The maximum performance could be determined by installed SATA
2 x red SATA3, provided by ASM1601 chipset
Dual BIOS、1 X front panel header and 1 X USB 2.0 device slot

The upper right side of motherboard
The color of DDR3 DIMM slot is also red in order to be consistent to the other parts,
from which we can see that FOXCONN pays a lot of attention on minor design as well. The upper black part is 24-PIN power input.
The right black parts are front USB3.0 expansion slots.

The upper side of motherboard
LGA 2011 CPU adopt 14 phase digital PWM, heat sink on upper side of motherboard could heat dissipation for MOSFET
Both left and right side, 4 X DIMM DDR3 which supports up to 32GB of system memory
Quad channel DDR3 2400(oc*)/2133 (oc*)/1866(oc*)/1600/1333/1066, supports Extreme Memory Profile

IO
1 X PS2 keyboard port
6 X USB 2.0(black)
1 X Clera CMOS button(black triangle)
1 X S/PDIF out port
2 X Gigabit LAN
2 X USB 3.0(blue)
2 X eSATA(orange)
6 ports audio jacks

OC Switch Button
In the OC mode, pressing the OC_SW2 button will increase the CPUclock by 1MHz per step, and the debug led code will increase 0.1 at the same time.
The debug led code “0.1” means the CPU clock is101MHz.
A row of sliver small round dot means PCB Voltage Sensor which users could directly measure voltage.

-
AS SSD Benchmark - 1482
Seq Read - 927.59 MB/s Write - 598.25 MB/s
4K-64Thrd Read - 487.57 MB/s Write - 433.79 MB/s

AS SSD Benchmark performance is not double but several items and total score are over 1.9 times more.
IOMETER 2008
4KB Test - 100% Write / 100% Random 4KB
Total I/Os per Second 122020.57
SiSoftware Sandra Write 604.177 MB/s

100% Random 4k Write reaches 122K IOPS. It’s helpful for small files processing.
SiSoftware Sandra Write is also steady. The average is around 600 MB/s.
Performance Pro 128GB installs Windows7 Ultimate 64bit to test booting time.
Installing all hardware drivers and Intel Smart Response Technology.
BootRacer
Time to Logon 6 seconds
Time to Desktop 12 seconds

The booting speed doesn’t improve. It may be caused by clean system can be handled by single SSD already.
If I get the chance, I will install more software and compare the booting speed again.
SSD cannot support TRIM mode in Raid 0. It’s waiting Intel to provide new Raid TRIM software in the future.
Performance Pro web page shows the background garbage collection can support TRIM command to solve performance drooping issue in Raid mode.
It needs to be approved after long time usage. Anyway, it’s a great news for SSD Raid users.
Finally, I use NoteBook to test performance.
Due to NoteBook Raid 0 supported models are over 16 ~17 inches , after consideration, I choose acer TimelineX 3830TG for single SSD performance test.
3830TG color is very eye catching. The upper cover is aluminum. It’s also slim design.
It is built-in individual graphics and 6Cell battery. The price is very affordable. No doubt it’s hot selling model.

CORSAIR Performance Pro Series 128GB install in SATA3 as system drive.
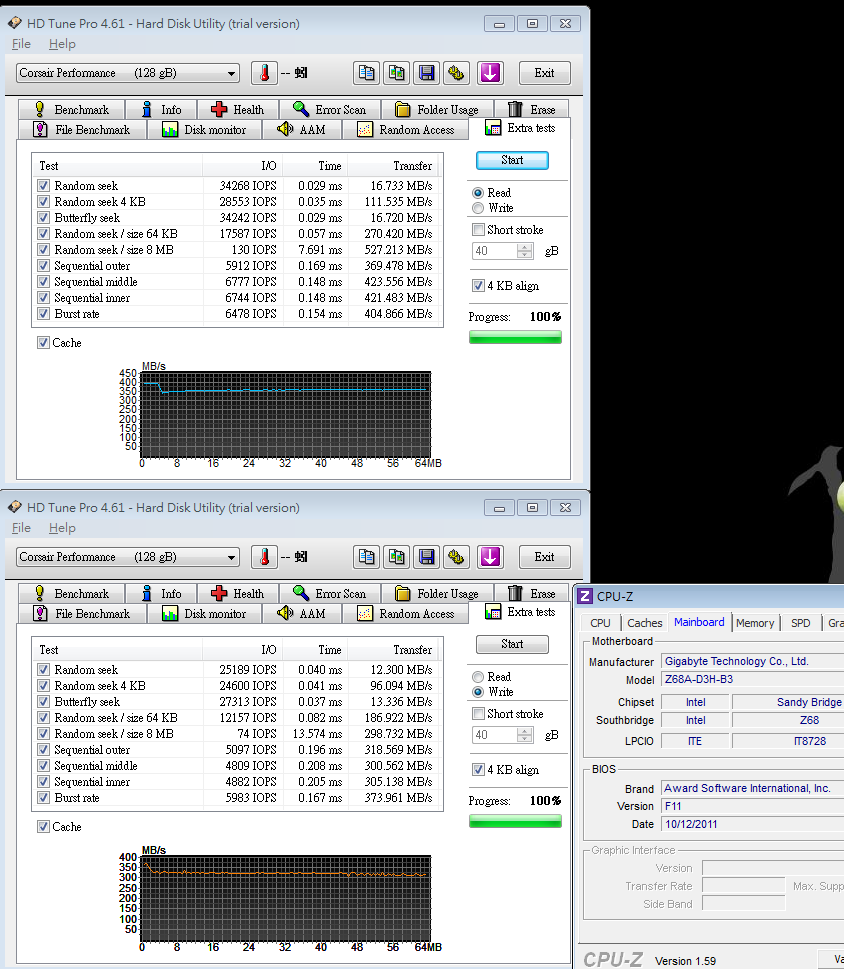
HD Tune Pro 4.60 Benchmark
Read - Average 469.4 MB/s Access Time 0.078ms
ATTO DISK Benchmark max read is 507.6 Mb/s and write is 335.1 MB/s.
File Benchmark over 2048k read test is over 450 MB/s.
CrystalDiskMark Seq Read - 437.3 MB/s Write - 316.5 MB/s

AS SSD Benchmark - 795
Seq Read - 460.55 MB/s Write - 293.41 MB/s
4K-64Thrd Read - 269.23 MB/s Write - 229.08 MB/s

NoteBook SATA transfer rate is a little bit slower than DeskTop, especially in 4K.
However, in 3830TG SATA3 transfer rate, the performance is still acceptable.
BootRacer
Time to Logon 8 seconds
Time to Desktop 14 seconds

Booting speed compares with former shared SSD and HDD reviews.
TOSHIBA MK6461GSY 640GB 7200 time to Desktop is 42 seconds.
CORSAIR Force GT 120GB(SandForce SF-2281) time to Desktop is 16 seconds.
CORSAIR Performance Pro 128GB(Marvell 88SS9174) time to Desktop is 14 seconds.
It’s all test in same NoteBook and installed same drivers and software.
Two SSD are much faster than HDD. Performance Pro is even faster than Force GT.
Normally, SSD key performance role is controller. This SSD also shows the importance of NAND FLASH.
Previous Marvell 88SS9174 bundle with other brands NAND FLASH spec is as below:
Read is 450 MB/s, Write is 210 MB/s and 4K Write is 14000 IOPS.
CORSAIR Performance Pro uses same Marvell 88SS9174 but NAND FLASH changes to TOSHIBA.
The spec change to 500MB/s read, 340MB/s write and 60000 IOPS 4K write.
You can see no matter read/write performance is improved. Even 4K write also improves 2~4 times. It’s really excellent performance.

Native SATA3 has been launched a year. The SSD performance is breakthrough.
SSD Read/write performance is over 400~550 MB/s and 4K performance is over double as SATA2 stage.
Performance Pro built-in advanced garbage collection solves Raid mode performance dropping after long time used.
CORSAIR SSD product line has SandForce SF-2281 with Force GT and Marvell 88SS9174 with Performance Pro.
They are both highest performance controller so far. After combining high performance synchronized NAND FLASH, the transfer rate is even higher.
As SSD brands tough competition stage, besides SSD performance, users also need to consider brand awareness, warranty, price and stability.
Windwithme share this latest technology SSD as your reference guide.
Wish all of you can find the best C/P value hardware in coming year. Happy New Year 2012 and Gong Xi Fa Chai. Thanks:)
This article is also post in my blog WIND3C, Any comments are welcome.
-
Install LAN drivers.
BootRacer
Time to Logon 6 seconds
Time to Desktop 12 seconds

After entering OS desktop, LAN will search for a while, it takes 2~3 more seconds after installing LAN drivers.
Performance Pro booting speed is very impressive. It takes only 12 seconds under all drivers installed condition.
Of course, after you install more daemons, the booting speed will be slower. This number is for a reference.
2nd part is using two 128GB for Raid 0 mode.

As Raid 0 experience, Intel chipset has better performance in Raid0 mode.
The mainstream is LGA 1155 Z68 or LGA 2011 X79 platforms.

Two CORSAIR Performance Pro Series 128GB install at white SATA3.
Non OS drive and empty data.
HD Tune Pro 4.61 Benchmark
Read - Average 947.2 MB/s Access Time 0.155ms
Write - Average 608.7 MB/s Access Time 0.039ms

Random Access
Extra tests
Sequential middle
Read - 882.489 MB/s
Write - 345.845 MB/s

File Benchmark over 256k read is over 900 MB/s.
ATTO DISK Benchmark achieves read 1025 Mb/s and write 651.5 MB/s.

ATTO DISK Benchmark can test SSD best read/write performance and doesn’t take long test time.
This part is almost double the official spec. It really shows Raid 0 max performance.
ADIA64 Read Test Suite - Linear Read(Middle) 952.7 MB/s
SSD Benchmark TOTAL 5388.02

CrystalDiskMark
Seq Read - 930.3 MB/s Write - 643.1 MB/s
<All 0xFF, 1Fill> Read - 929.9 MB/s Write - 646.2 MB/s
<All 0x00, 0Fill> Read - 929.7 MB/s Write - 648.6 MB/s

ADIA64 Linear Read Average 1659.2 MB/s
CrystalMark Sequential Read 932.63 MB/s Sequential Write 616.11 MB/s
ADIA64 Linear Read test appears unexpected acceleration sometimes.
Every 5 times test cycle, 1 or 2 times will appear extreme high bandwidth. Average performance is around 9xxMB/s.
-
Single CORSAIR Performance Pro Series 128GB install at white SATA3
Non OS drive and empty data.
HD Tune Pro 4.61 Benchmark
Read - Average 524.3 MB/s Access Time 0.028ms
Write - Average 308.9 MB/s Access Time 0.035ms

HD Tune Pro Read and Write are quite steady.
Access Time is 0.28~0.35ms which helps for performance.
Random Access

Extra tests
Sequential middle
Read - 423.556 MB/s
Write - 300.562 MB/s
File Benchmark over 1024k read is over 450 MB/s.
ATTO DISK Benchmark max read is 506.4 Mb/s and write is 340.1 MB/s.

ATTO DISK Benchmark reaches official spec, 500MB/s read and 340 MB/s write.
ADIA64 Read Test Suite - Linear Read(Middle) 527.9 MB/s
SSD Benchmark TOTAL 3755.72

CrystalDiskMark
Seq Read - 480.3 MB/s Write - 317.4 MB/s
<All 0xFF, 1Fill> Read - 478.1 MB/s Write - 327.6 MB/s
<All 0x00, 0Fill> Read - 478.7 MB/s Write - 326.6 MB/s

CrystalDiskMark 3 modes performance are similar. Marvell 88SS9174-BKK2 controller stability is excellent.
As SanForce controller uses special algorithm, the performance only improve at <All 0xFF, 1Fill> and <All 0x00, 0Fill>.
ADIA64 Linear Read Average 534.0 MB/s
CrystalMark Sequential Read 455.22 MB/s Sequential Write 312.75 MB/s

AS SSD Benchmark - 865
Seq Read - 494.30 MB/s Write - 298.43 MB/s
4K-64Thrd Read - 267.13 MB/s Write - 230.45 MB/s
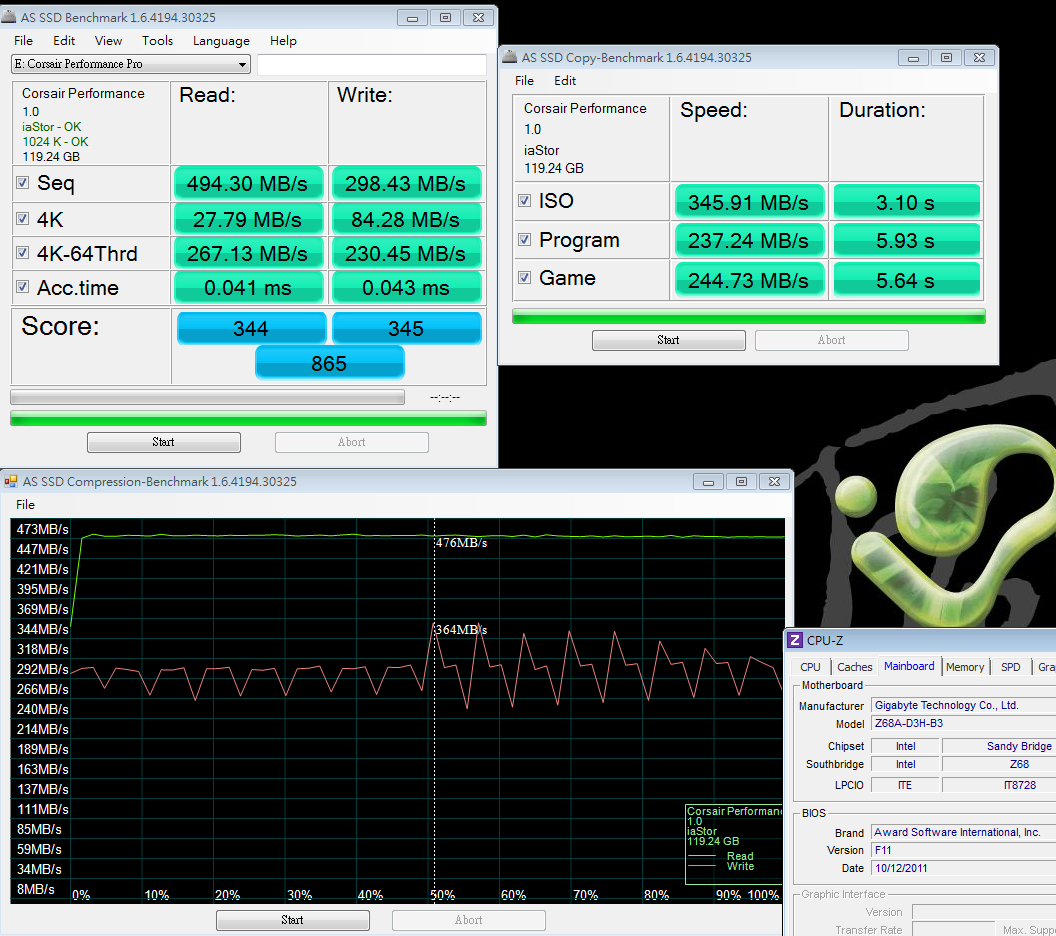
AS SSD Benchmark is the best performance in this SSD
4K is not as good as SandForce SF-2281 controller.
However, Seq Write and 4K-64Thrd transferring are excellent. The score is 865.
IOMETER 2008
4KB Test - 100% Write / 100% Random 4KB
Total I/Os per Second 66941.48
SiSoftware Sandra Write 300.251 MB/s

IOMETER 2008 test 100% Random 4k Write also achieves 67K IOPS.
This part only loses SanForce 85K IOPS. It’s 2nd best performance so far.
Performance Pro 128GB installs Windows7 Ultimate 64bit to test booting time.
LAN chip is not installed. The other drivers and Intel Smart Response Technology are installed.
BootRacer
Time to Logon 4 seconds
Time to Desktop 9 seconds

-
In 2011, Intel and AMD both launched native SATA3 supported chipset.
SATA3 strength is 6Gb/s bandwidth that is double of SATA2.
It brings Solid-State Hard Drive performance into new competition stage.
SSD performance is combination of controller chip and NAND FLASH.
NAND FLASH also divides into SLC and MLC. Now the mainstream market is MLC.
Nowadays, MLC performance is not much different with SLC. MLC writing life cycle is also improved by new algorithm technology.
Of course, MLC market price is much lower than SLC, the future trend still go this way.
Last year, best SATA3 controllers were SanForce and Marvell.
Intel 510 Series SSD also used Marvell.
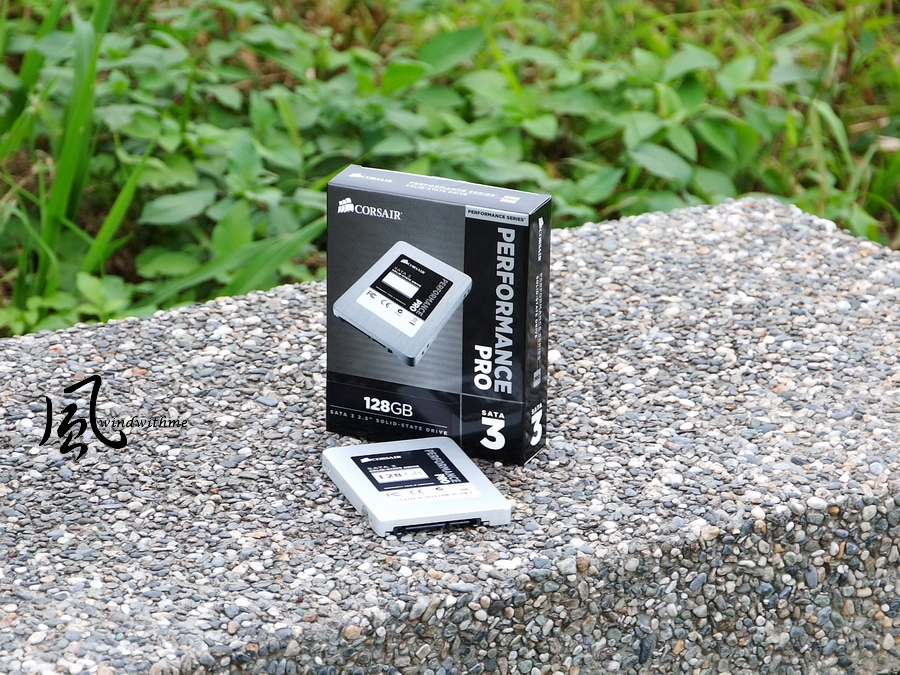
This SSD is from CORSAIR latest series - Performance Pro Series.
It’s different naming with former Performance 3 Series, but the packing seems belong to same product line.

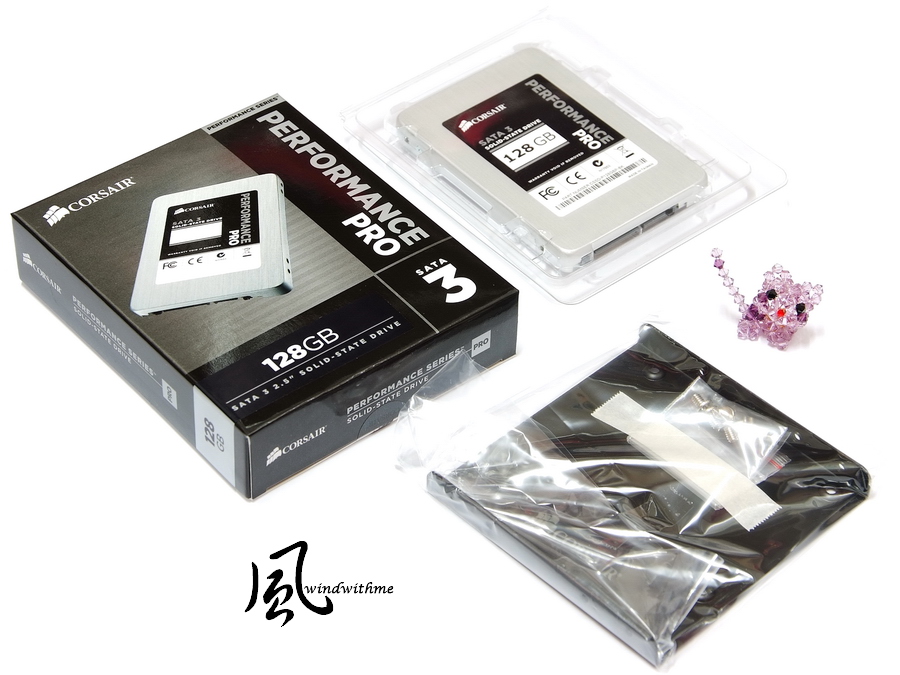
Content
Upper right is Performance Pro 128GB. Lower is 3.5” adapter and screws.
It’s 2.5 inches and 128GB capacity. Max Sequential Read/Write official spec, using ATTO Disk Benchmark, is 500/340 MB/s.
Random 4K max writing performance is 60000 IOPS. It’s very high spec in SSD market now.

The shell is silver coated with brushed finish. The texture is similar to sleek metal.
CORSAIR provides 3 years warranty. It has 128GB and 256GB.
I hope they can provide 564GB in the future for more options.

Backside material and tone are same as front.
You can see 2 silver laser stickers in lower right and left. It’s for warranty and internal hardware protection. I suggest you to keep it as origin.
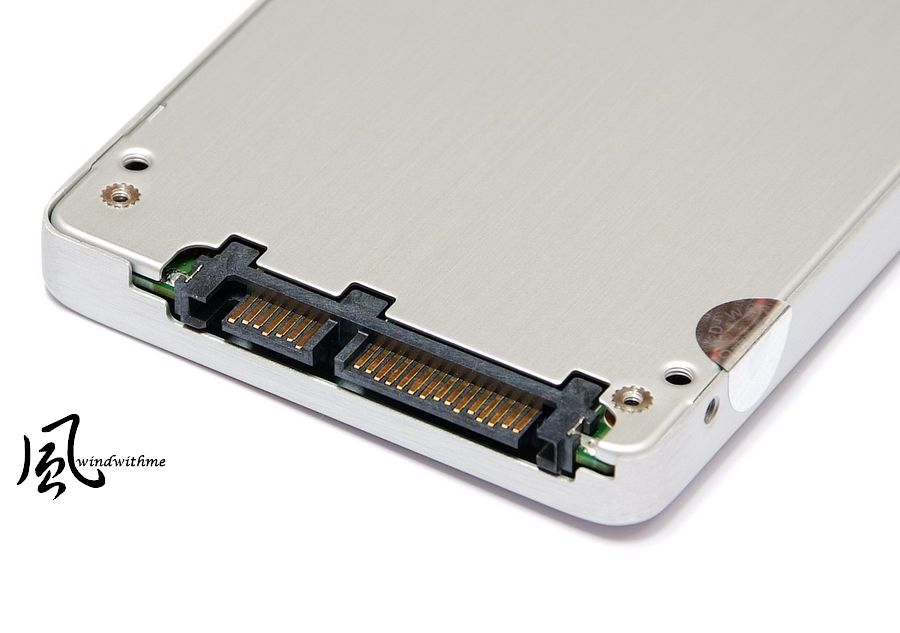
This is SATA3 and power connectors. It’s same as SATA2. Users need to distinguish SATA3 by packing or spec sticker.
Performance Pro uses Marvell 88SS9174-BKK2 controller.
NAND FLASH is TOSHIBA 34nm, 16GB per chip. DRAM Cache is NANYA DDR3 256MB.
So far, I only see PLEXTOR SSD using this combination and it’s been launched for months.
In Nov, CORSAIR launched Performance Pro. The performance should be the most average one.
First of all, Intel DeskTop platform uses GIGABYTE Z68A-D3H-B3 supports Raid 0.
It’s with 3 PCI-E X16, 2 PCI-E X1 and 2 PCI. It’s good expandability in ATX platform.

Z68 also supports GPU output. It supports 3 output interfaces and blue one is USB 3.0 port.
Z68 exclusive Intel Smart Response Technology supports small capacity SSD and HDD making hybrid speed up.

Intel Z68 chipset is mid-high segment product. It’s easy to find in the market.
In the past 6 months, MB tough competition made Z68 entry model price is more parity and reasonable.
P67 and H67 position and price are not good as H61 and Z68, they are almost fade out from the market.
Test Configuration
CPU: Intel Core i5-2400
MB: GIGABYTE Z68A-D3H-B3
DRAM: CORSAIR CMX8GX3M2A1600C9
VGA: Intel HD Graphics 2000
HD: CORSAIR Performance Pro Series 128GB / TOSHIBA 750GB
POWER: be quiet! STRAIGHT POWER GOLDEN 550W
Cooler: Intel Original Cooler
OS: Windows7 Ultimate 64bit

-
Full Speed is 1.440V
After burning test and measure the MOSFET highest temperature is 85 degree C.
For next few X79 models review, I will also provide this temperature for reference.
CPU voltage fluctuation is bigger than old BIOS.
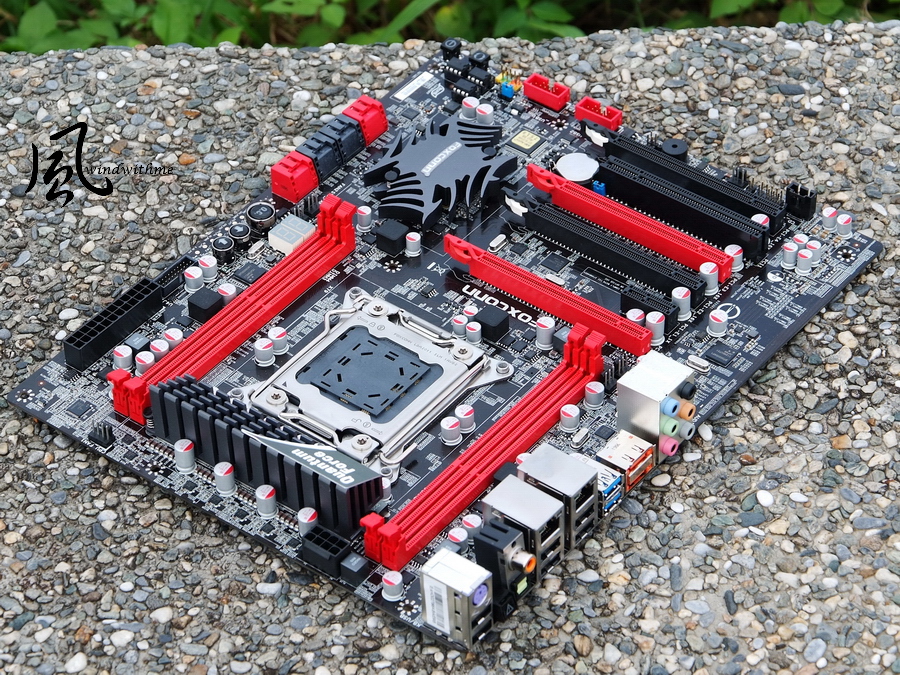
GIGABYTE G1.Assassin2
Good
1. G1-Killer series packing and components are better than own high end product.
2. Spec-in UEFI BIOS and provide 2 BIOS interfaces
3. Built-in Creative CA20K2 audio chip, Japanese high end audio caps and 128MB Memory cache.
4. Killer E2100 Networking NPU with 1GB DDR2 cache for better networking traffic management.
5. Unique BT4.0 and Wi-Fi PCI-e card. For mobility century, this is really useful features.
6. Front panel has USB 3.0 and quick OC features. It also has audio headset amplifier.
Weakness
1. Chipset heatsink design is not good looking
2. 8 DIMM DDR3 design will be better
3. Before booting screen, if you click USB KB in advance, it may cause undetectable issue.
4. CPU voltage fluctuation is bigger between standby and full speed.
Performance ★★★★★★★★★☆
Components ★★★★★★★★☆☆
Specification ★★★★★★★★★☆
Appearance ★★★★★★★★☆☆
C/P Value ★★★★★★★☆☆☆
All MB makers launch X79 series to replace X58.
The price is around 265~430 USD.
For users don’t have high end audio or LAN card and you are considering to buy these two high end cards, G1 cost should be similar.
LGA 2011 is Intel most high end product. The price is top of pyramid.
You can pick up the platform by budget. Sandy Bridge structure has very wide.
Lowest H61 can combine with Celeron G530. Entry OC has Z68 with i5-2500K.
Mid-end OC has Z68 with i7-2600K/2700K and future you can have X79 plus i7-3820.
If you need heavy multi-tasking and shorter working time, X79 with i7-3930K/3960X is the best performance combo.
The test result above shows Sandy Bridge-E structure is still the king of Desktop performance.
There are i7-3930K and 3960X, 6C12T, CPU support multi-tasking performance.
LGA 2011 CPU pricing structure is same as LGA 1366.
Till 2012, i7-3820 4C8T launched, the enthusiasts will have one more choice.
This year, there is only i7-2600K/2700K with Z68. Soon after, X79 with i7-3820 will become another option.
Windwithme will keep sharing more brands X79 performance and OC guide.
Wish all Happy New Year 2012 and you can find your best C/P PC combo in 2012.Thanks.
This article is also post in my blog. WIND3C Any comments are all welcome.
-
CrystalMark 2004R3 => 435077
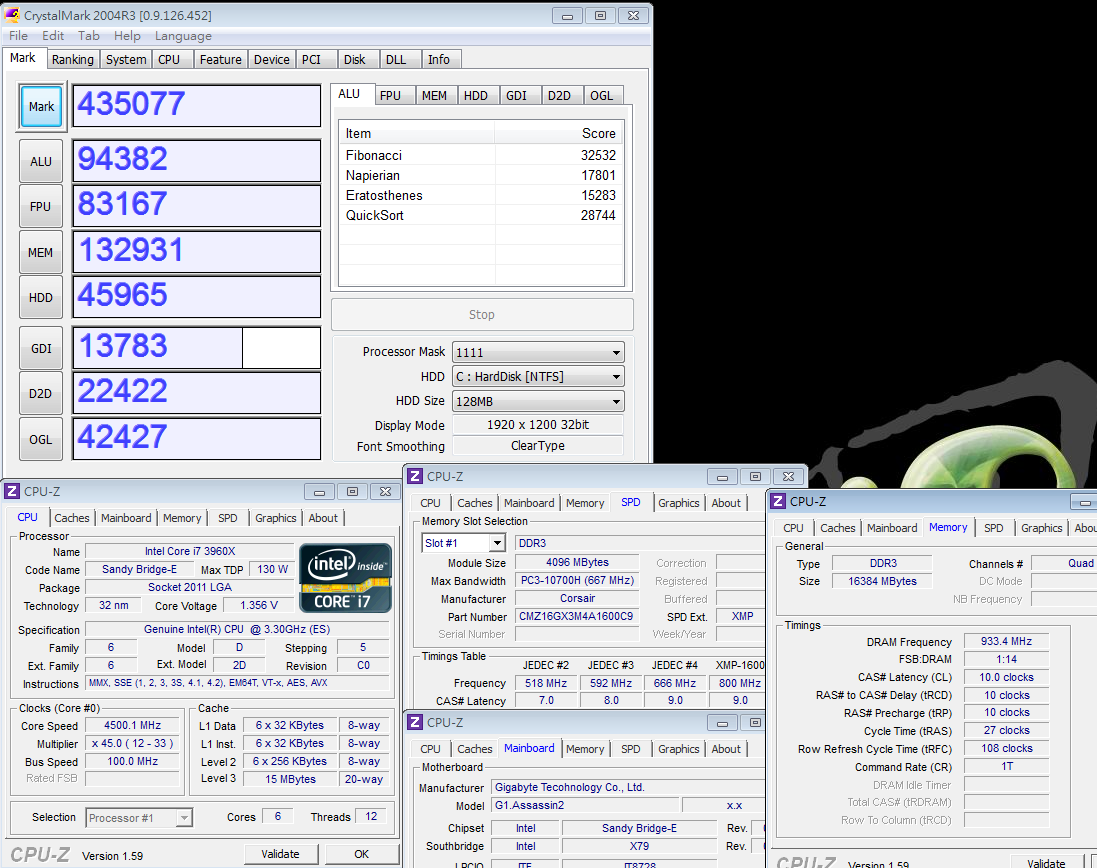
CINEBENCH R11.5
CPU => 13.13 pts
CPU(Single Core) => 1.82 pts
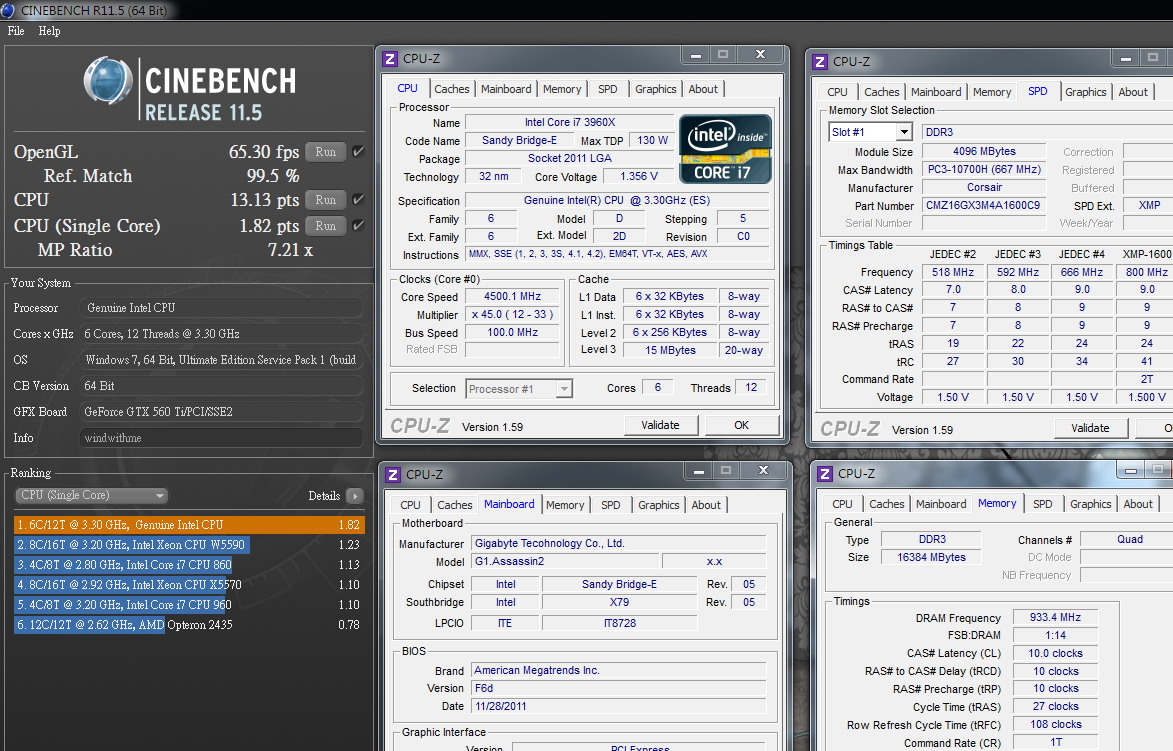
PCMark Vantage => 26980
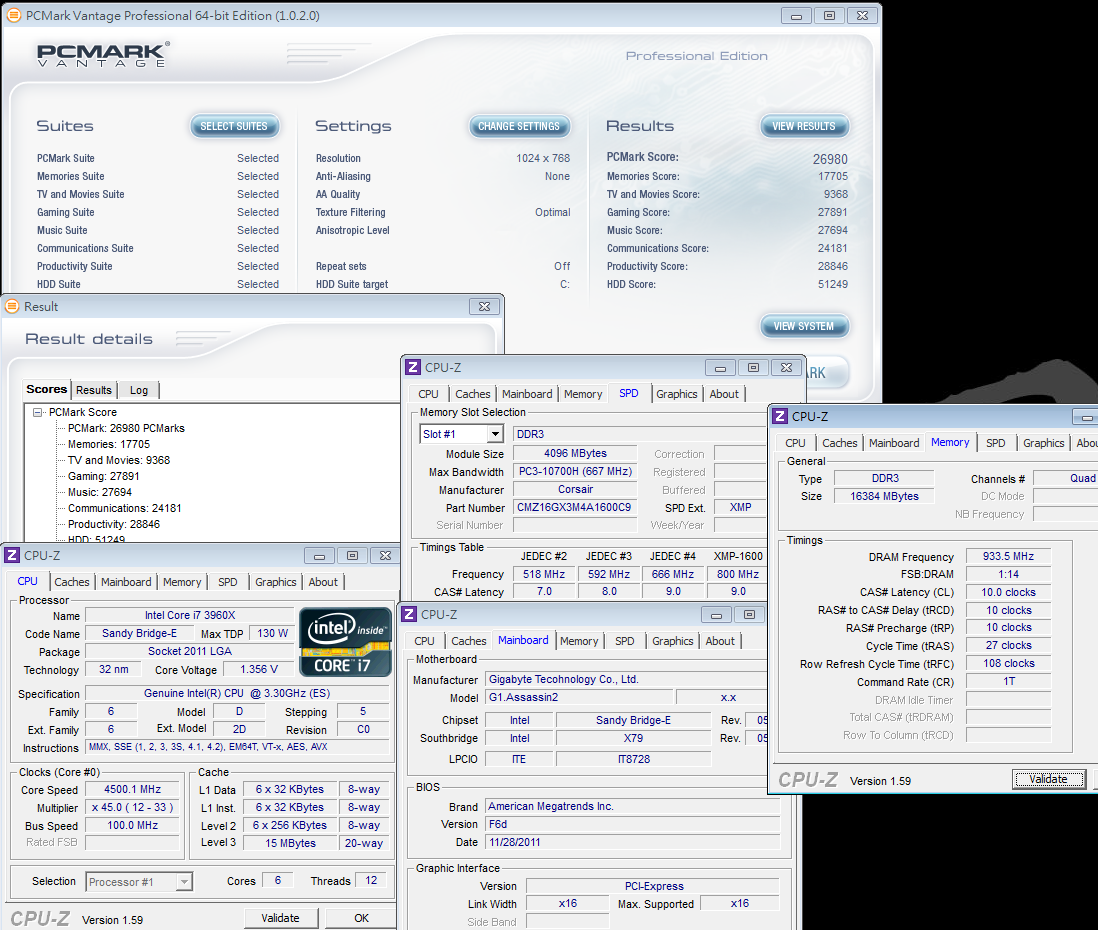
3960X OC to 4.5GHz, the single core performance increase around 20% and multi-core increase 20~30%.
You don’t need high voltage for this clock. You can use this setting for long time stably.
Both OC and practical usage can run smoothly. Of course, you can go higher speed, but you need rise the voltage or improve your cooling kit.
x264 FHD Benchmark => 35.7
x264 video converting rate increase from 28.8 to 35.7, about 24% higher.
You can save lots of converting time. If you have high demand for this, single thread and multi-core are very important.
DDR3 Test
ADIA64 Memory Read - 20088 MB/s
Sandra Memory Bandwidth - 45878 MB/s
MaXXMEM Memory-Copy - 16374 MB/s
DDR3 performance increase 15~20% as speed OC from DDR3 1600 to DDR3 1866.
No matter Sandy Bridge or Sandy Bridge-E, DDR3 bandwidth is extremely high.
Especially the quad channel strength, the bandwidth is amazing. This is the key advantage of LGA 2011.
Temperature Test (Room Temp. is 22˚C)
Enter to OS Desktop - 33~37
CPU full speed by LinX - 62~70
After pulling high clock and voltage, CPU full speed temperature rise obviously.
It’s lower 70 in full speed condition. If you install in chassis, it will increase another 3~5. For 6C12T, it’s pretty good.
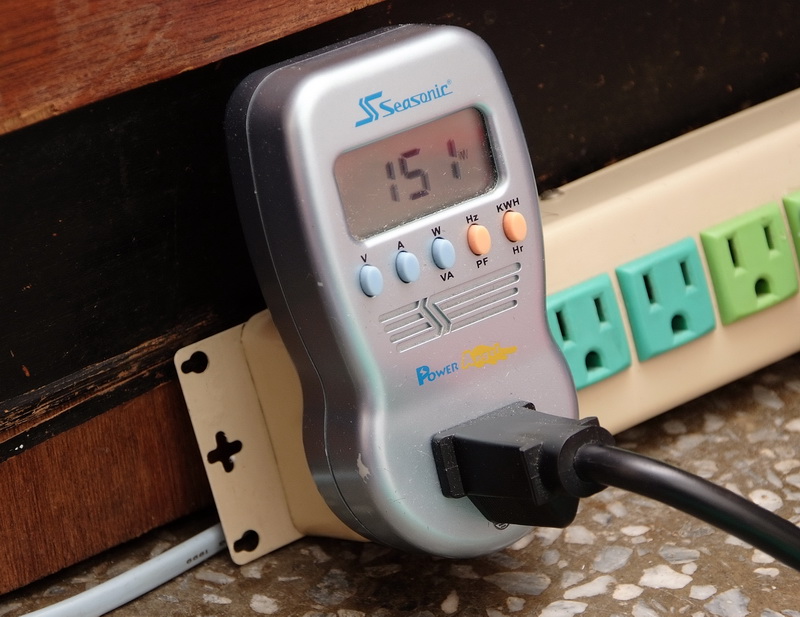
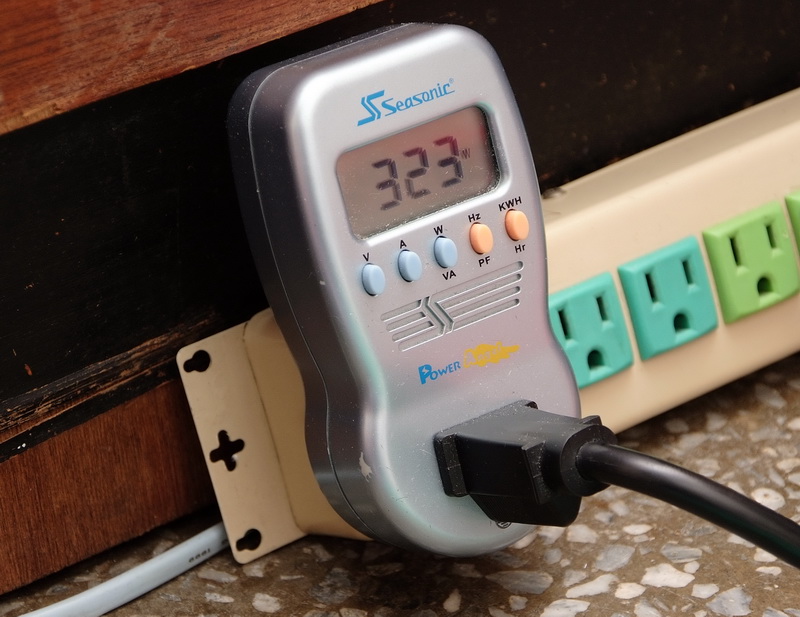
Power Consumption Test
Enter to OS Desktop - 151W
CPU full speed by LinX - 323W
Disable C1E mode, enter to OS desktop consume 151W. If setting CPU as default and disable C1E, it consumes 120W.
In OC condition, power consumption increases a lot. It’s 131W more than default mode. However, the performance also enhances 20%.
It depends on your idea. If the high performance cost you 323W, will you think it’s acceptable? I think it’s still ok.
I just flash BIOS to latest F7 and running stability test at 4.6GHz.
Enter to OS Desktop is 1.476V
-
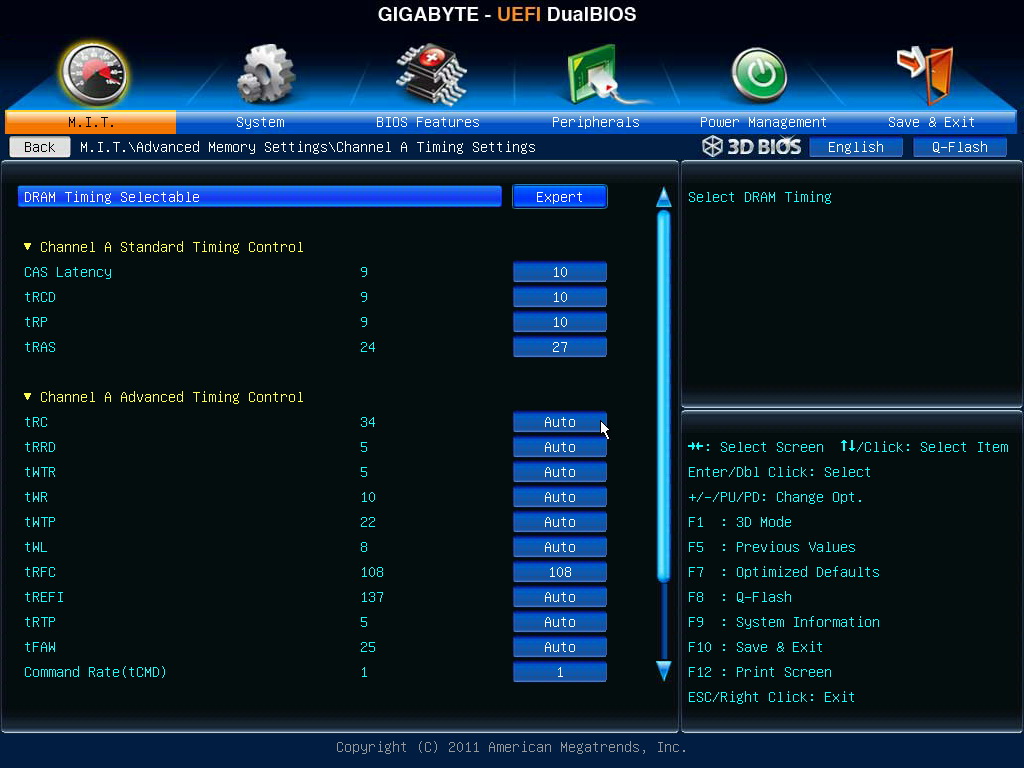
Advanced Memory Setting
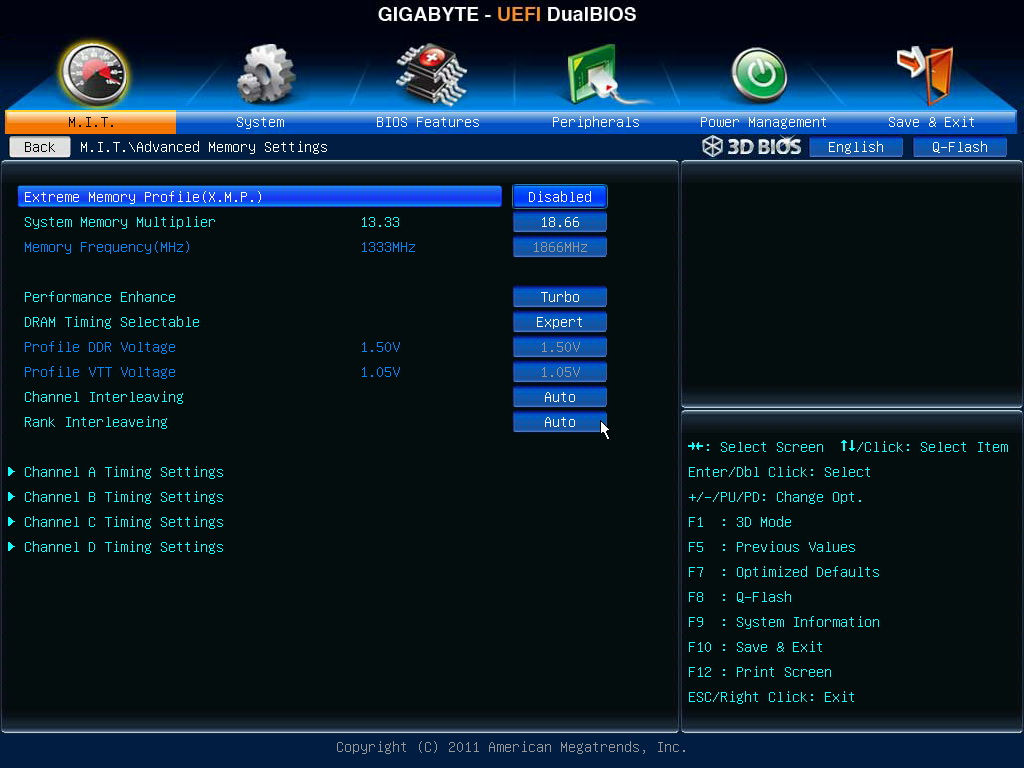
Due to it is quad channel, you can set Channel A/B/C/D.
I do suggest GIGABYTE can add one more option to setup all channels at once. It will be more convenient.
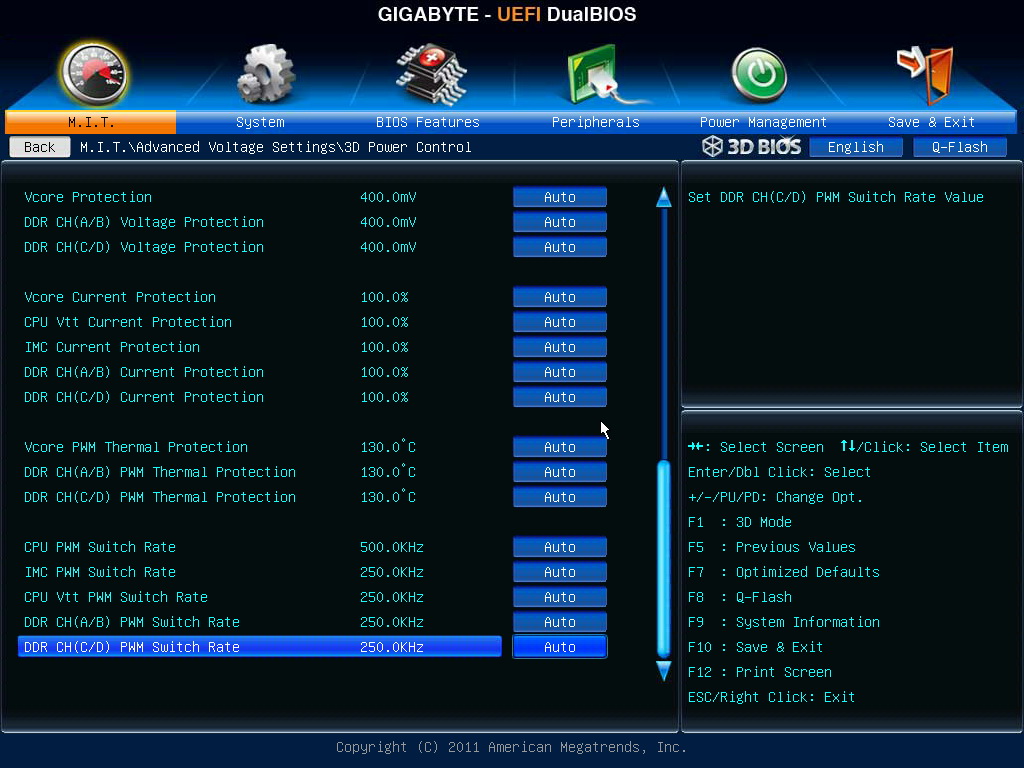
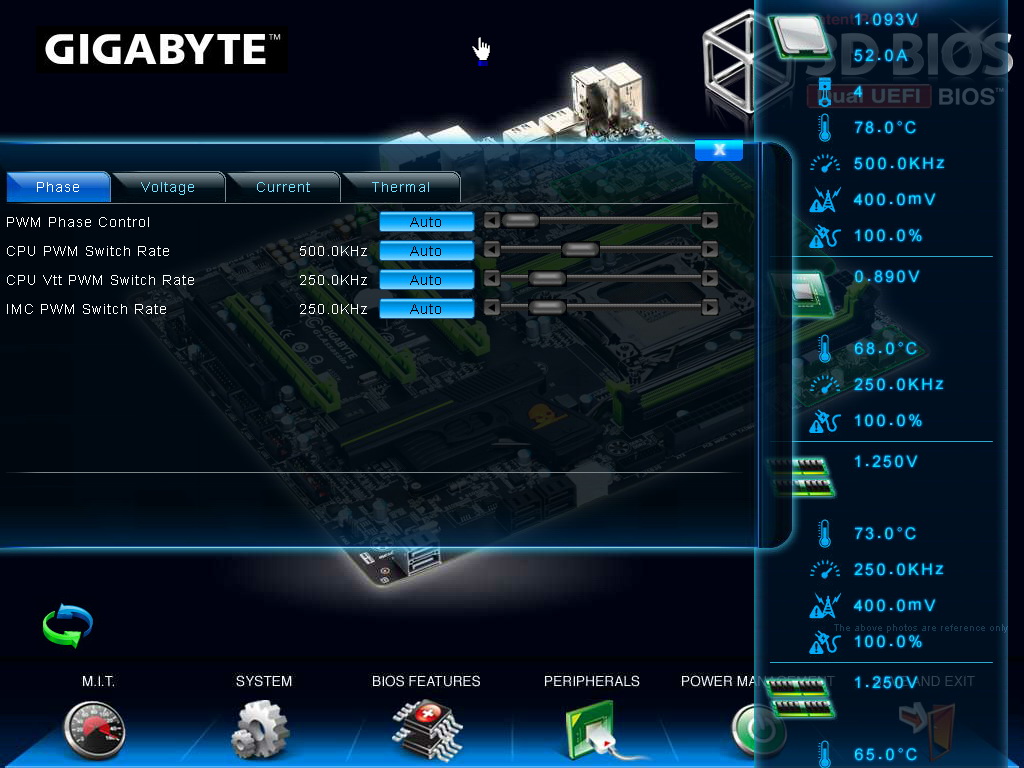
3D Power Control, I don’t change any items here.
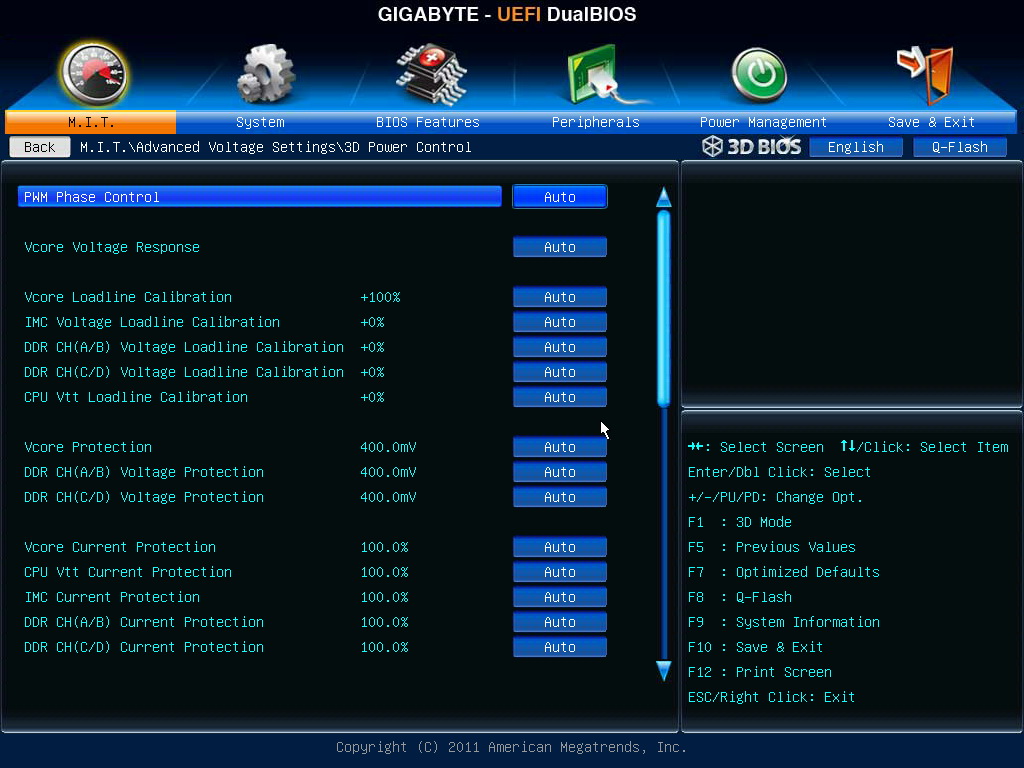
Very rich voltage items for enthusiasts to fine tune the system.
CPU Vcore 0.800~1.735V
CPU Vtt 0.865~2.075V
CPU PLL 1.195~1.985V
IMC 0.665~1.835V
DRAM Voltage 1.100~2.100V
PC Health Status
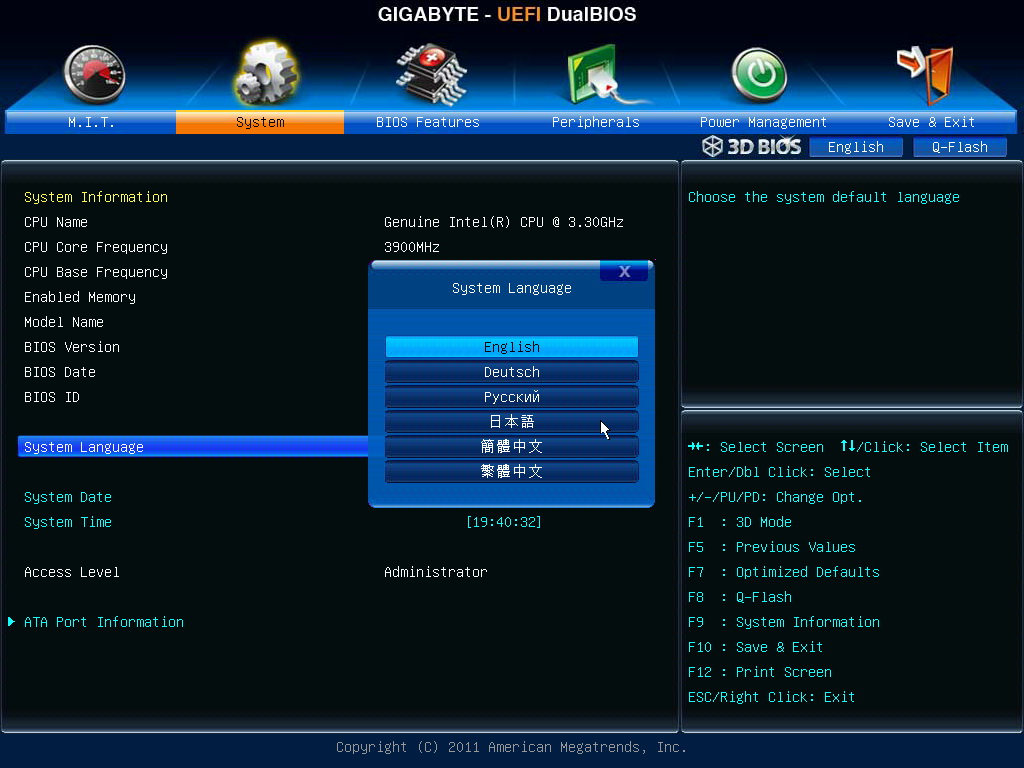
This BIOS provides 6 different languages.
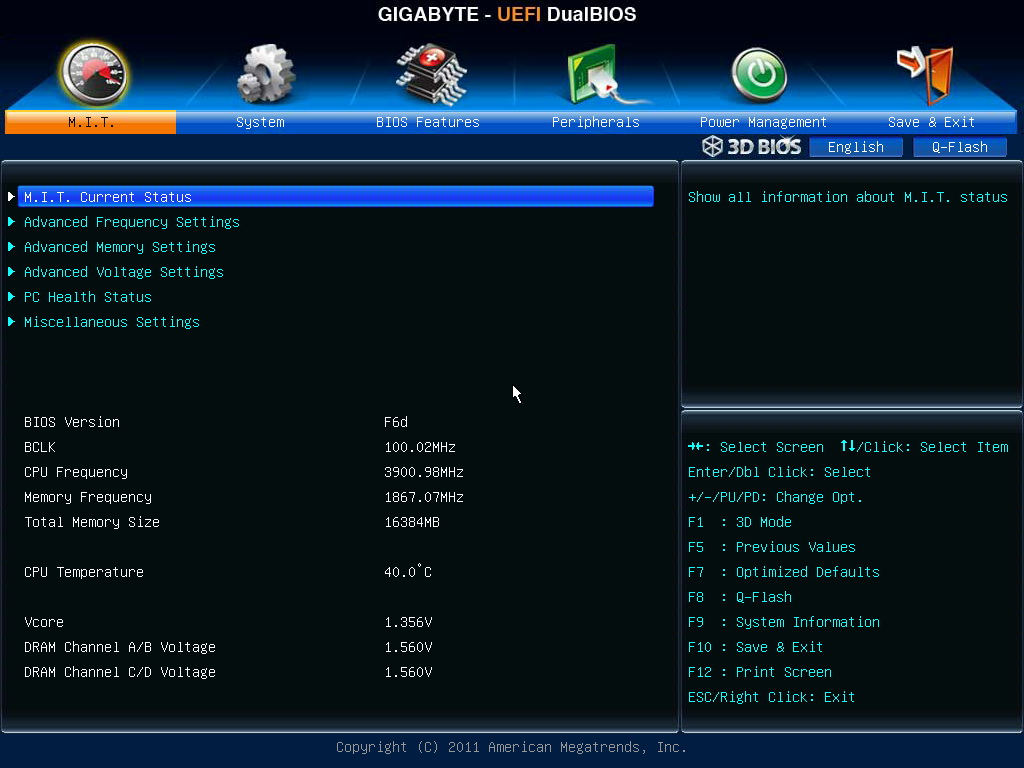
Sandy Bridge-E CPU can OC by 2 ways. First is increasing ratio and the other is pull frequency.
Of course, you can adjust simultaneously to get the best performance.
If DDR3 set as default, 100MHz, based on quality, the range is around 1600~2400.
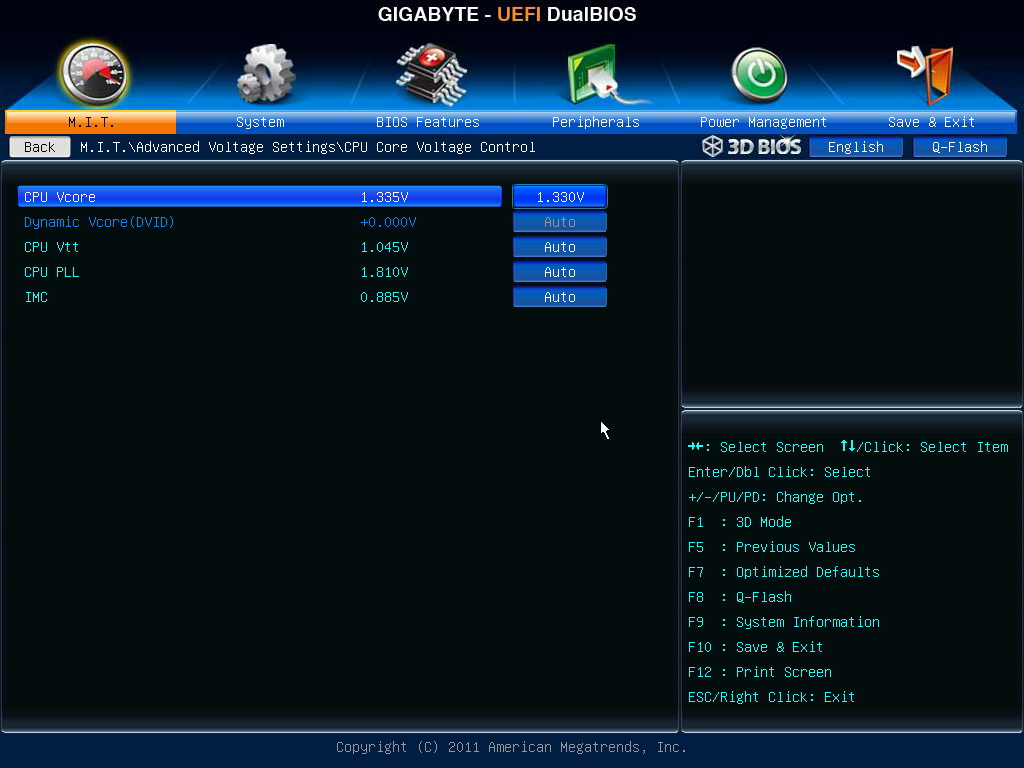
Setting above is my 3960X running at 4.5GHz. Every CPU quality and cooler are may vary. You will need to fine tune some items.
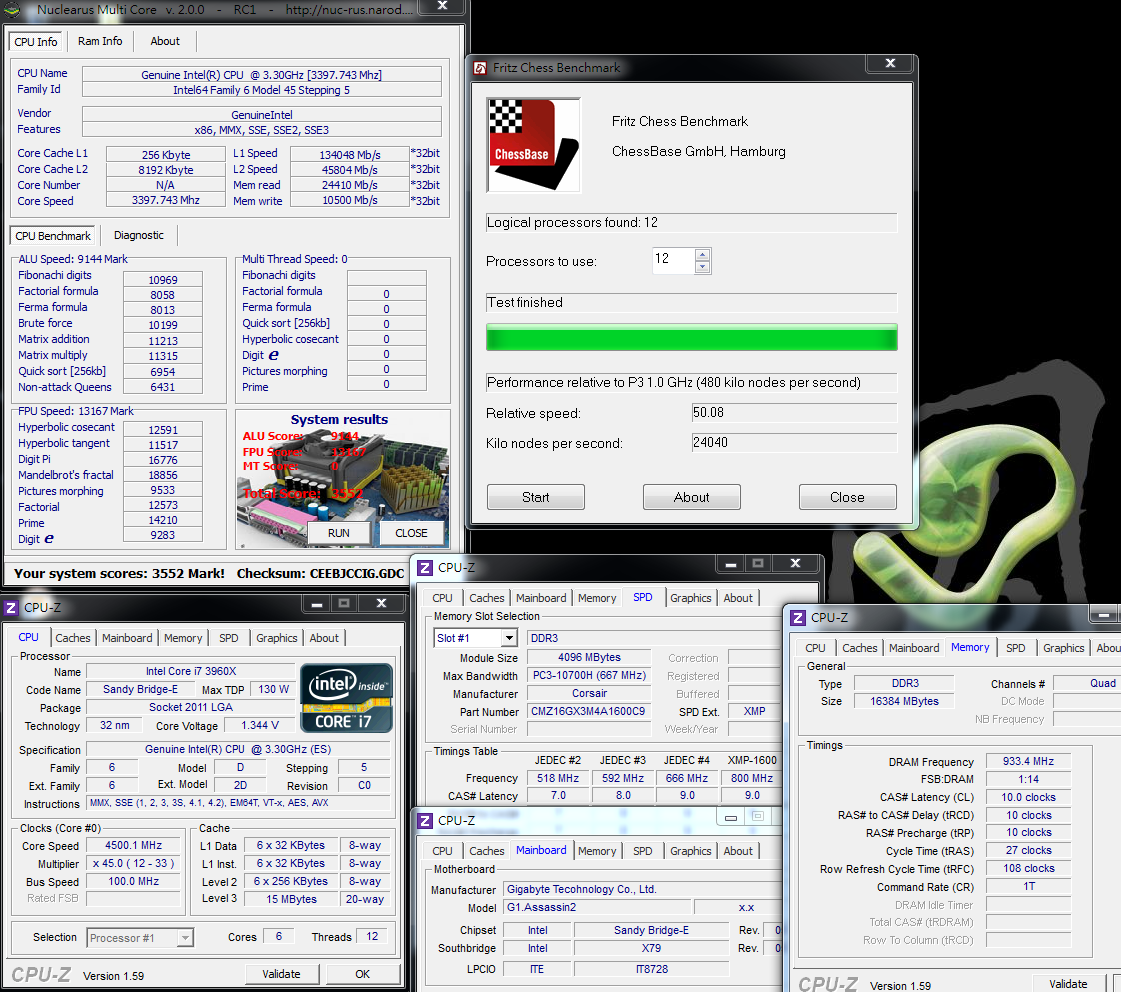
OC Test
CPU 100.0 X 45 => 4500.1MHz 1.335V
Disable C1E and Turbo Boost
DDR3 1866.8 CL10 10-10-27 1T 1.550V
Hyper PI 32M X 12 => 12m 06.556s
CPUMARK 99 => 688
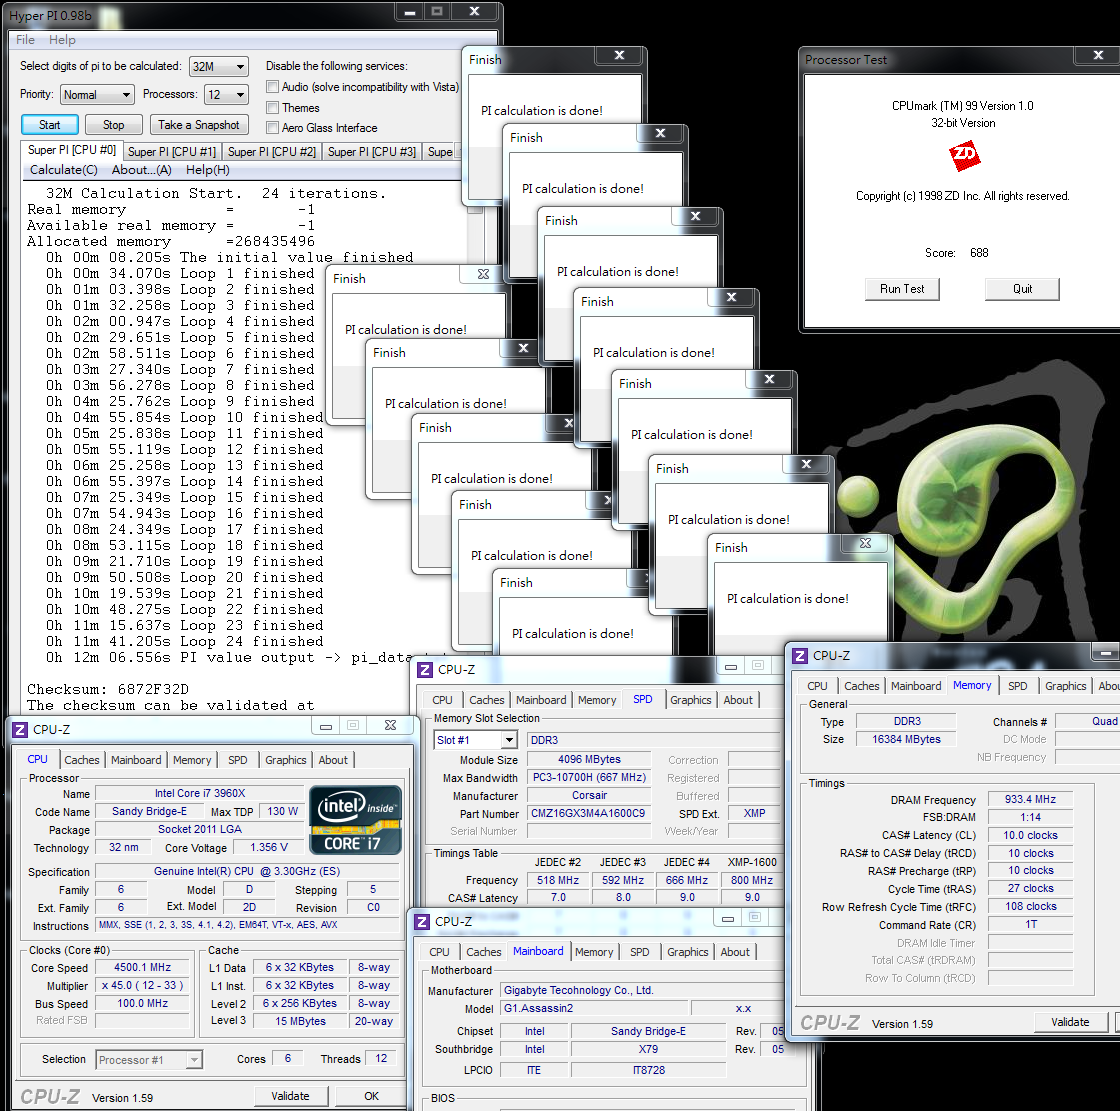
Nuclearus Multi Core => 3552
Fritz Chess Benchmark => 50.08/24040
-
Power Consumption Test
Enter to OS Desktop - 84W
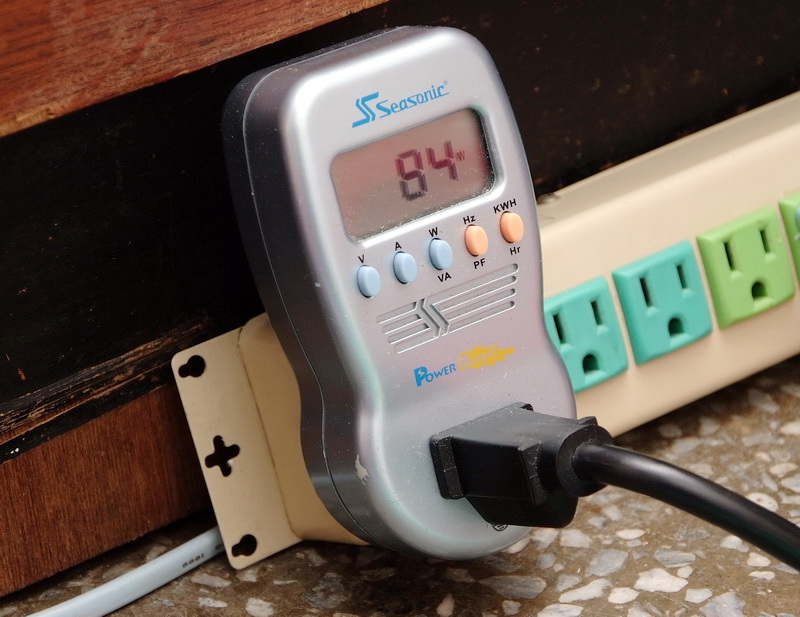
CPU full speed by LinX - 192W

After stability test for a while and fixing CPU voltage at 1.135V, C1E mode make CPU voltage vibrate between 0.800 to 1.240V as CPU clock changed.
This voltage only increase 3W in OS desktop but lower 30W in full speed which make full speed power usage be more efficient.
GIGABYTE BIOS spec in UEFI technology in X79 series.
The main screen has 2 parts, this is different with other UEFI BIOS.
First interface is 3D BIO. The GUI is using product outlook.
Users can move mouse cursor to hardware part, and enter to frequency or voltage setup.
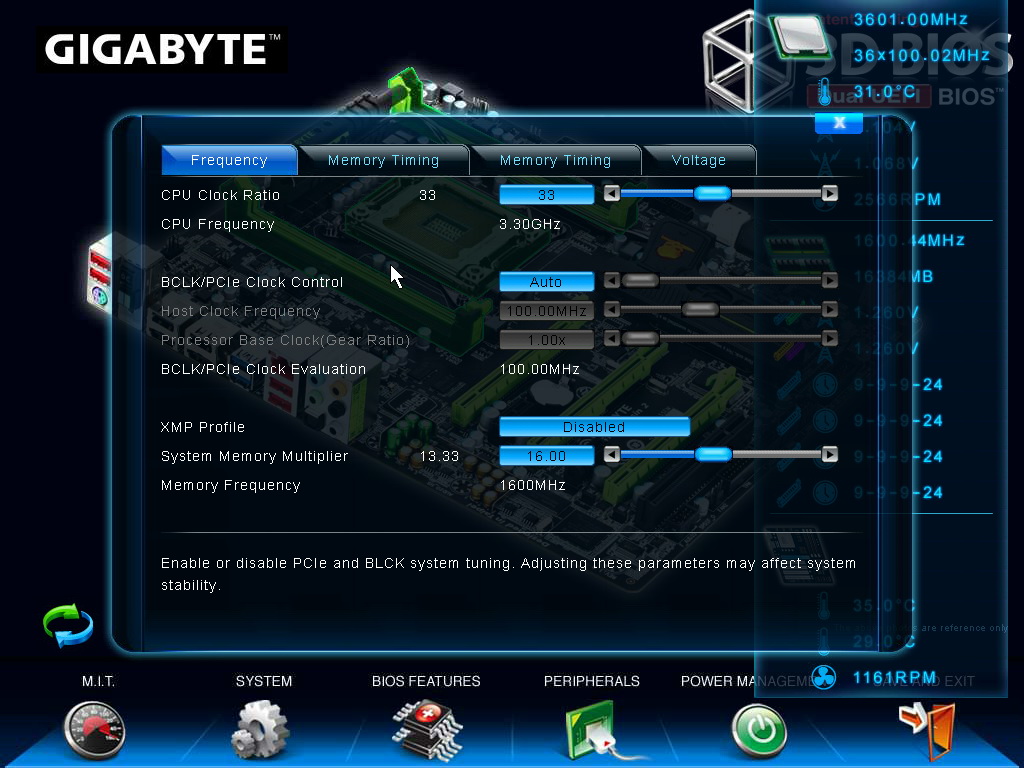
Click in PCI-E/PCI part screen.
Lower-left corner rotation logo can rotate MB angles.
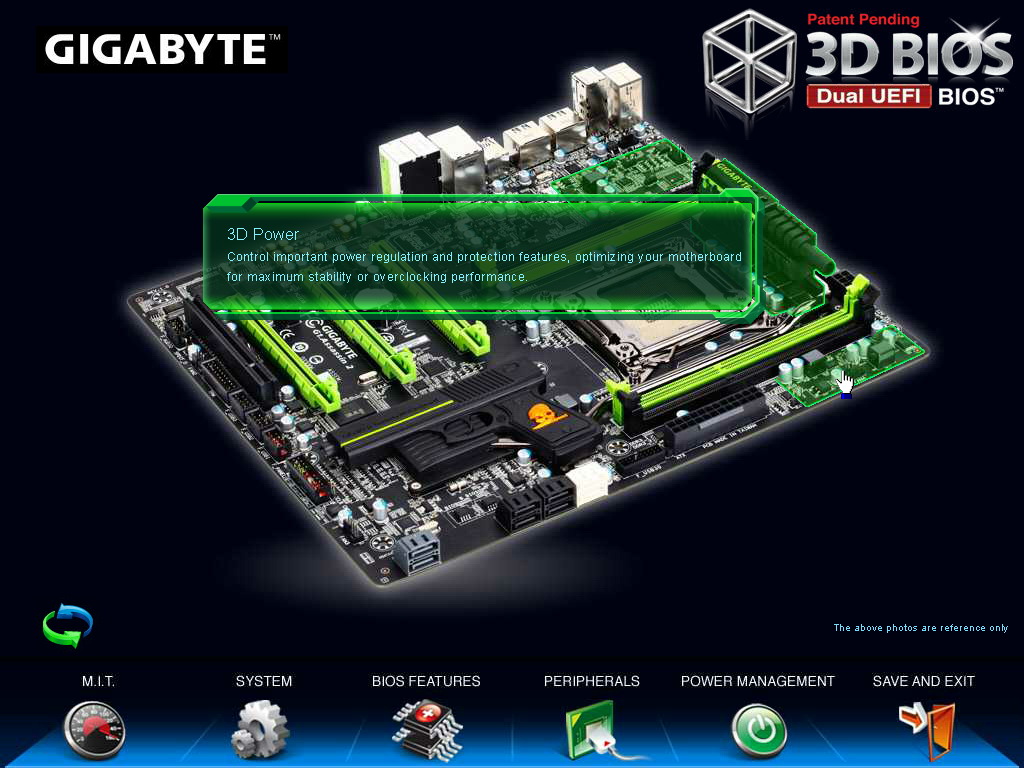
This interface is more fit GUI and user can understand the system status easily.
Press ECS to shift to normal UEFI page.
Even though transferring to UEFI, the items are almost same to old BIOS. Users have no adaptation issue.
Below is windwithme setup in OC mode. First of all, the CPU ratio adjust to 45.
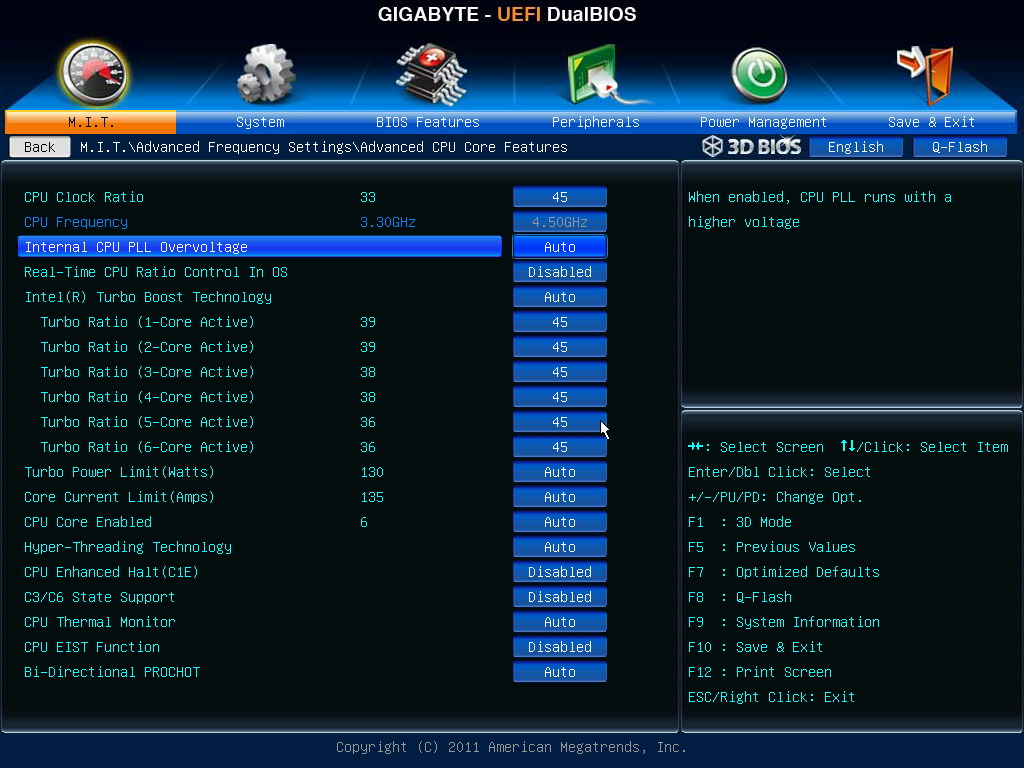
Advanced CPU Core Features
You can adjust individual core ratio and choose how many cores you want.
C1E is power saving mode. Intel Turbo Boost is opposite C1E. CPU speed will increase by loading status.
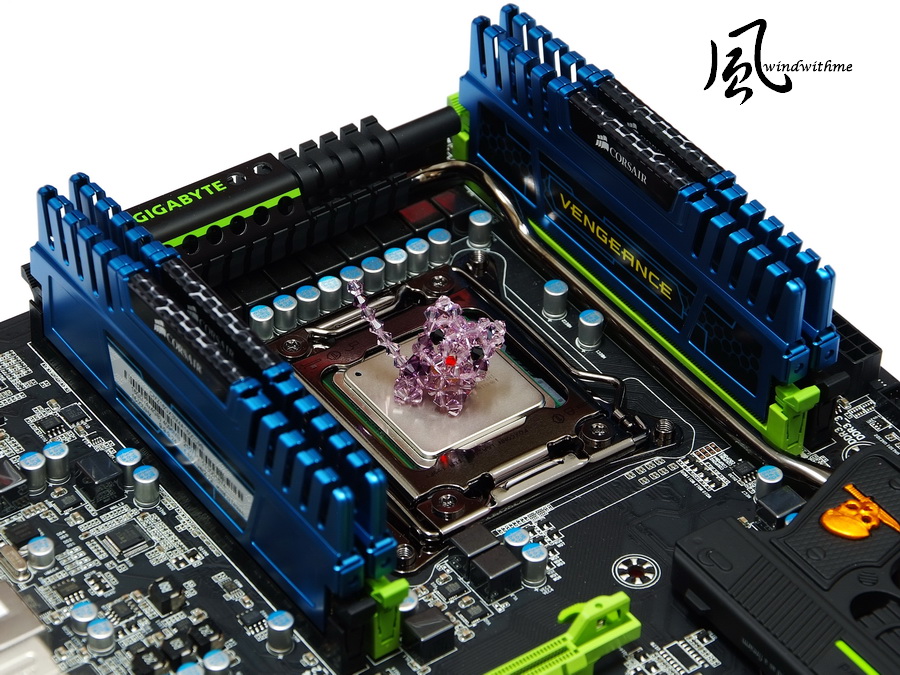
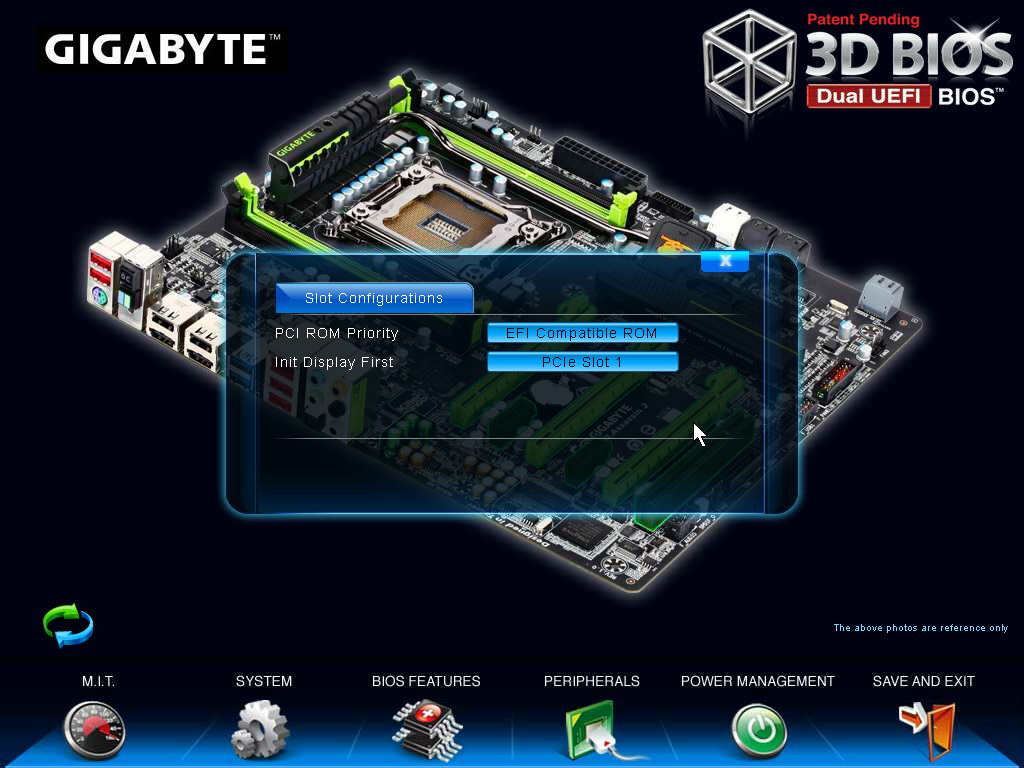
A High-end X79 Equipped with SAS and 4Way SLI - An OC Test of the ECS X79R-AX
in General overclocking
Posted
Qooltech IV cooling device, which displays an orange pattern when the temperature rises to a certain range
Back of motherboard has MOS driver components
X79 heat sink, which will also display a special color when the temperature reaches a certain level
The MOSFETs and chipsets all use Qooltech IV cooling modules, which together with the heatpipe design can effectively balance the temperature on both sides
Photo of UEFI, providing choice of 10 different languages
M.I.B X-
Can set clock parameters or voltage settings for CPU and DRAM
Voltage Levels
CPU VCORE Voltage -300 to +700 mV
CPU VSA Voltage -300 to +600 mV
CPU VTT Voltage -200 to +500 mV
PCH Voltage -200 to +300 mV
DRAM Voltage -300 to +500 mV
Page with information on CPU and related technology
If you want to fix the CPU clock to avoid being beat by energy-saving technology, you should select the following two options
Turn off Power Technology and Enhanced Halt (C1E)
Page on advanced CPU options
This can be used to independently set the multiplier for each CPU Core, and here all the CPU multipliers are set to 46
Page on DDR3 settings
Turn on XMP technology, allowing the DDR3 clock to increase to 2133
Detailed parameters are Cl9 11-10-27 2T
PC Health Status